
Extended Data Figure 1. BET bromodomain inhibitor JQ1 blocks cell growth, induces apoptosis and transcriptionally suppresses anti-apoptotic factor BCL-xl without affecting BRD2/3/4 proteins.
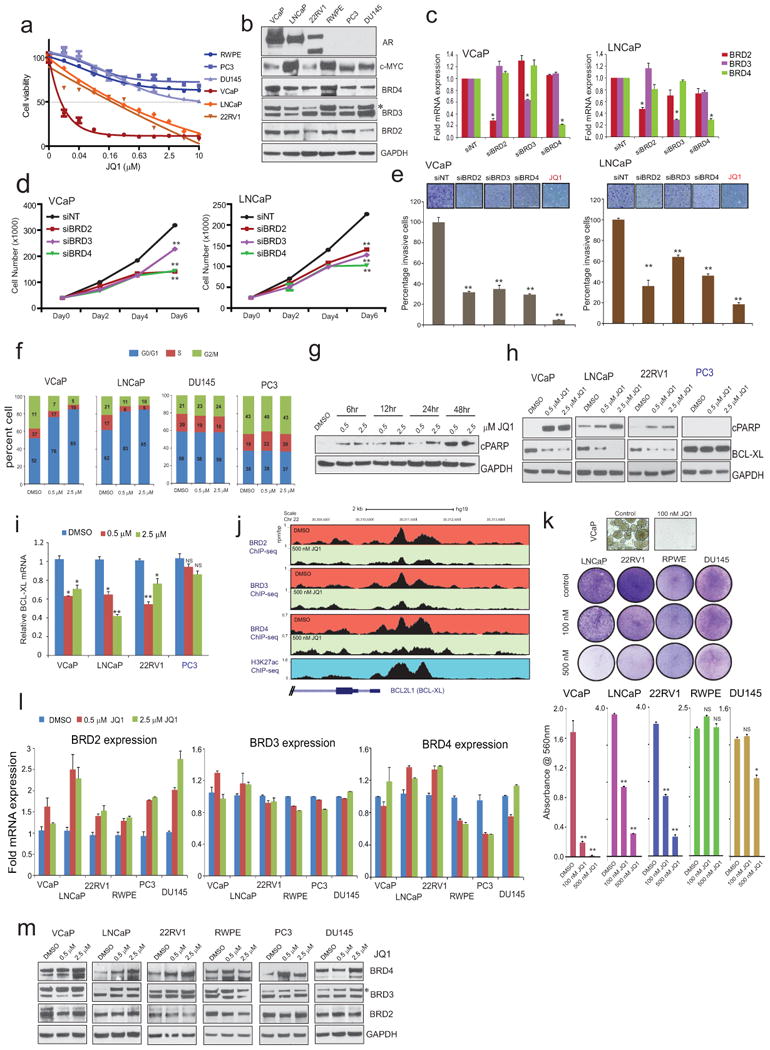
a, Cell viability curves for the 6 prostate lines treated with JQ1. N=6 wells of a 96 well plate per condition. b, BET-bromodomain proteins are ubiquitously expressed in prostate cell lines. AR and MYC protein levels are also shown. GAPDH serves as a loading control. c, Knockdown of BET-bromodomain proteins attenuates cell proliferation and invasion. Q-RT-PCR analyses of BRD2, BRD3 or BRD4 in VCaP cells transfected with siRNA against their respective transcript or NT (non-targeting) siRNA. Data show mean ± S.E. (n=3) from one of the three independent experiments. d, VCaP and LNCaP cell proliferation after indicated gene knockdown. 20,000 cells were seeded in 24-well plates following 24hrs post-transfection with siRNAs and counted on Day 0, 2, 4 and 6 (n=3) by coulter counter. Data show mean ± S.E. e, VCaP and LNCaP cell invasion (n=6) after indicated gene knockdown. JQ1 was used at 500nM. f, Cell cycle analysis of JQ1-treated prostate cell lines (after 48hr treatment with JQ1). Data represent 3 independent experiments. g, Induction of apoptosis as determined by appearance of cleaved PARP (cPARP) in VCaP prostate cancer cells by JQ1. GAPDH served as a loading control. h, Immunoblot demonstrating an increase in cPARP and decrease in BCL-xl in all three AR-positive cell lines compared to AR negative PC3 cells upon JQ1 treatment. i, Relative BCL-xl mRNA levels as determined by TaqMan qPCR in JQ1-treated cells. Data show mean ± S.E. (n=3) from one of three independent experiments. j, ChIP-seq data depicting loss of BRD2/3/4 recruitment to the BCL-xl promoter upon JQ1-treatment in VCaP cells. The Genome browser representation of BRD2/3/4 binding events on the BCL-xl promoter region. The y-axis denotes reads per million per base pair (rpm/bp), the x-axis denotes the genomic position. The bottom panel depicts H3K27ac mark on the same promoter region in VCaP cells. k, Colony formation assays of prostate cell lines. Cells were cultured in the presence or absence of 100 and 500nM of JQ1 for 12days followed by staining (upper panel) and quantification (lower panel, mean ± S.E. n=6). Representative photographs of crystal violet stained colonies (except for VCaP) used for quantification is shown. l, BET bromodomain inhibitor JQ1 does not affect its target proteins. QRT-PCR analyses of BRD2, BRD3 and BRD4 in prostate cancer cell line panel treated with two different concentrations of JQ1 for 24hrs. Data show mean ± S.E. (n=3) from one of the three independent experiments. m, Immunoblot analysis of BRD proteins in prostate cell line panel treated with JQ1 for 48hrs. GAPDH serves as a loading control. Asterisks on (a) and (m) indicates non-specific band. Representative blots shown are from triplicate biological experiment. NS, not significant; *P ≤ 0.01; **P ≤ 0.001 by two-tailed Student's t-test.