
Extended Data Figure 2. Effect of JQ1 on AR target genes and on MYC transcription.
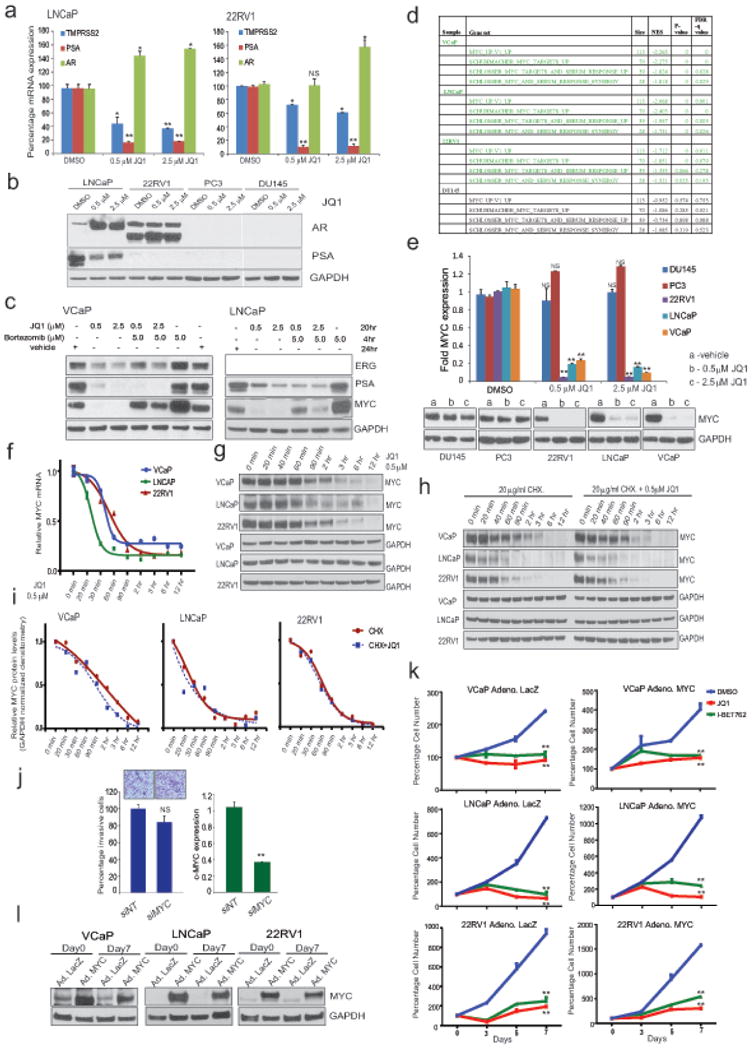
a, QRT-PCR analysis of indicated genes in LNCaP and 22RV1 cells treated with varying concentrations of JQ1 for 24hrs. Data show mean ± S.E. (n=3) from one of the two independent experiments. b, Immunoblot analysis of AR and PSA in a panel of prostate cancer cells after treatment with two different doses of JQ1. GAPDH serves as a loading control. c, ERG and PSA are transcriptional targets of JQ1. Proteasome inhibitor bortezomib does not rescue ERG and PSA levels in JQ1-treated VCaP cells. Immunoblot analyses of ERG and PSA in VCaP and PSA in LNCaP cells treated with JQ1 followed by incubation with bortezomib as indicated. MYC, known to be degraded by proteasome, was used as a positive control for bortezomib treatment. GAPDH serves as a loading control. d, GSEA showing loss of MYC signature (4 gene set) in AR-positive VCaP, LNCaP and 22RV1 cells but not AR-negative DU145 cells after JQ1 treatment; size- number of genes in each set; NES- normalized enrichment score; p- and FDRq, test of statistical significance. e, QRT-PCR and immunoblot analysis of MYC in JQ1-treated prostate cancer cells. Data show mean ± S.E. (n=3) from one of the two independent experiments. f, and g, time-course QRT-PCR and immunoblot analysis of MYC in AR-positive VCaP, LNCaP, and 22RV1 cells after JQ1-treatment. h, Cyclohexamide (translation inhibitor) treatment does not enhance JQ1-mediated loss of MYC protein ruling out post-translational degradation of MYC by JQ1. Time-course immunoblot analysis of MYC in VCaP, LNCaP, and 22RV1 cells treated with cyclohexamide or cyclohexamide+JQ1 as indicated. Representative blots from two independent experiments are shown. i, GAPDH-normalized MYC protein levels are shown. Band intensities from d were determined by ImageJ and the plots were generated using GraphPad Prism. j, MYC knockdown does not affect cell invasion. Box plot shows invasion of VCaP cells transfected with siNT or siMYC. Inset shows the image of invaded VCaP cells (n=6). Right, Q-RT-PCR of MYC upon siRNA transfection. Data show mean ± S.E. from one of the three independent experiments. k, Exogenous MYC introduction does not rescue JQ1-mediated cell growth inhibition. Cells were infected with control adeno-LacZ or adeno-MYC virus. Equal numbers of cells were plated 24hrs post infection and treated with 500nM JQ1 or I-BET762. Cells were counted (n=3 wells) and plotted; Day 0 of drug treatment was set at 100%. Data show mean ± S.E. from one of the four independent experiments. l, Immunblot analysis depicts overexpression of MYC in adeno-MYC infected cells on Day 0 and Day 7 of the experiment. GAPDH serves as a loading control. *P ≤ 0.05; **P ≤ 0.005 by two-tailed Student's t-test.