
Extended Data Figure 5. Influence of JQ1 and anti-androgens on genome-wide recruitment of AR and their effect on DHT induced AR target gene expression.
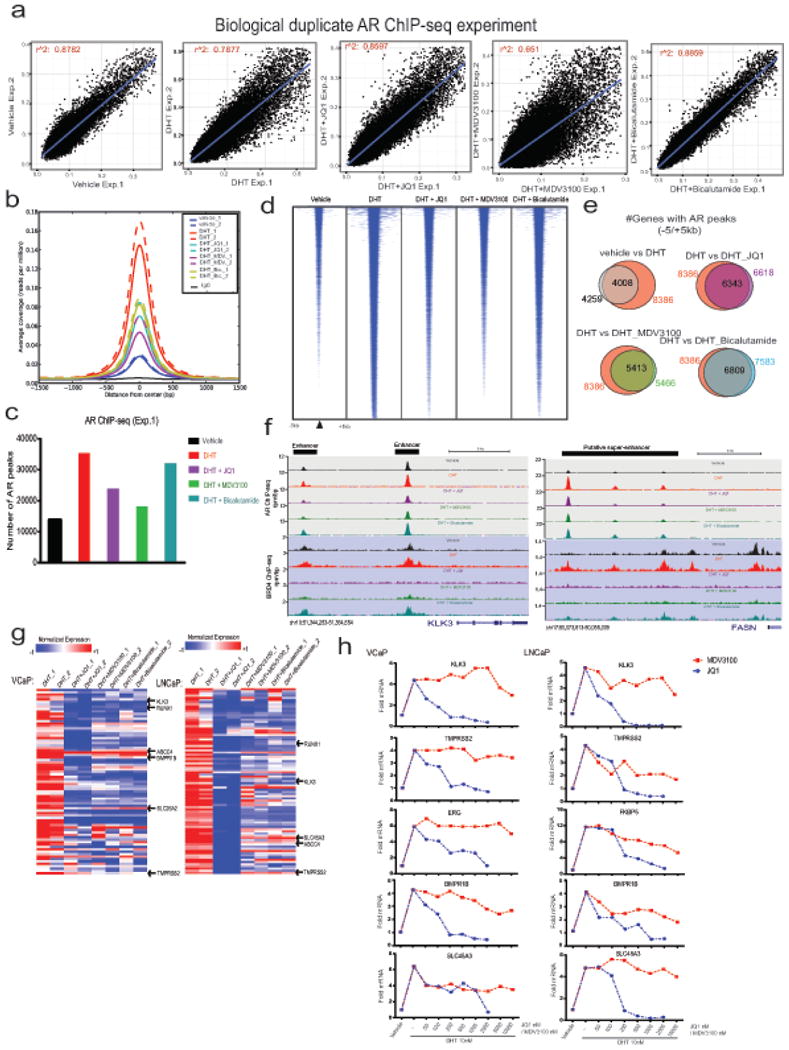
a, Two independent biological replicates of AR ChIP-seq experiments in VCaP cells show high correlation of normalized enrichment levels (see Methods) in the majority of treatment conditions. R-square values for each biological duplicate are shown. b, Mean enrichment (coverage) profiles are similar between biological replicates and different between treatment conditions, indicating that no adverse changes in enrichment levels are observed between the replicates. c, Bar graph showing total number of AR peaks for VCaP treated cells. The genome-wide individual peaks for AR yielded the highest number of peaks for DHT (35,390) whereas vehicle control cells displayed only 13,874 peaks However, the number of peaks for AR was 23,961, 18,264 and 32,212 in the presence of JQ1, MDV3100 and bicalutamide, respectively. d, Heatmap representation of AR binding peaks in different treatment groups. Genomic target regions are rank-ordered based on the level of AR enrichment at each AREs (Androgen Response Elements) within -1kb and +1kb flanking genomic region. e, Venn diagram illustrating the overlap of AR-bound genes between different treatment groups. f, AR-BRD4 binding on KLK3 and FASN upstream regions. Genome browser representation of AR and BRD4 binding events on a putative “enhancer” and “super-enhancer” of AR-regulated KLK3 and FASN gene respectively. The y-axis denotes reads per million per base pair (rpm/bp), the x-axis denotes the genomic position with a scale bar on top right. g, Expression of AR target genes in the presence of JQ1, MDV3100 or bicalutamide. Heat maps for VCaP and LNCaP cells treated with DHT (10nM), DHT+JQ1 (0.5μM), DHT+MDV3100 (10μM) and DHT+bicalutamide (25μM). Red arrows indicate well-characterized AR target genes. h, QRT-PCR analysis of AR-regulated genes in the VCaP and LNCaP treated cells. In order to directly compare JQ1 and MDV3100 in blocking AR signaling, cells were treated with varying concentrations of JQ1 or MDV3100 followed by DHT-treatment and analyzed for AR targets. The reduction in DHT-induced gene expression was observed for JQ1 even at 100-250nM whereas MDV3100 displayed a marginal reduction at 10μM, demonstrating the higher efficacy of JQ1 in blocking AR target gene expression. Data show mean ± S.E. (n =3) from one of the two independent experiments.