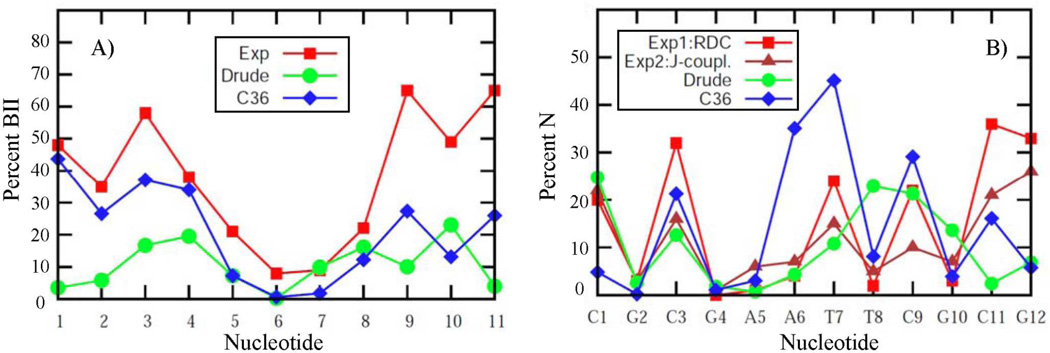
Figure 12.
Analysis of DNA sequence specific effects. (A) Percent BII conformation and (B) percent north conformation of the sugar moiety, as functions of nucleotide for EcoR1 from experiments and from the MD simulations using the C36 (blue) and Drude (green) force fields. Data for the symmetrically related base-pair steps have been combined.

