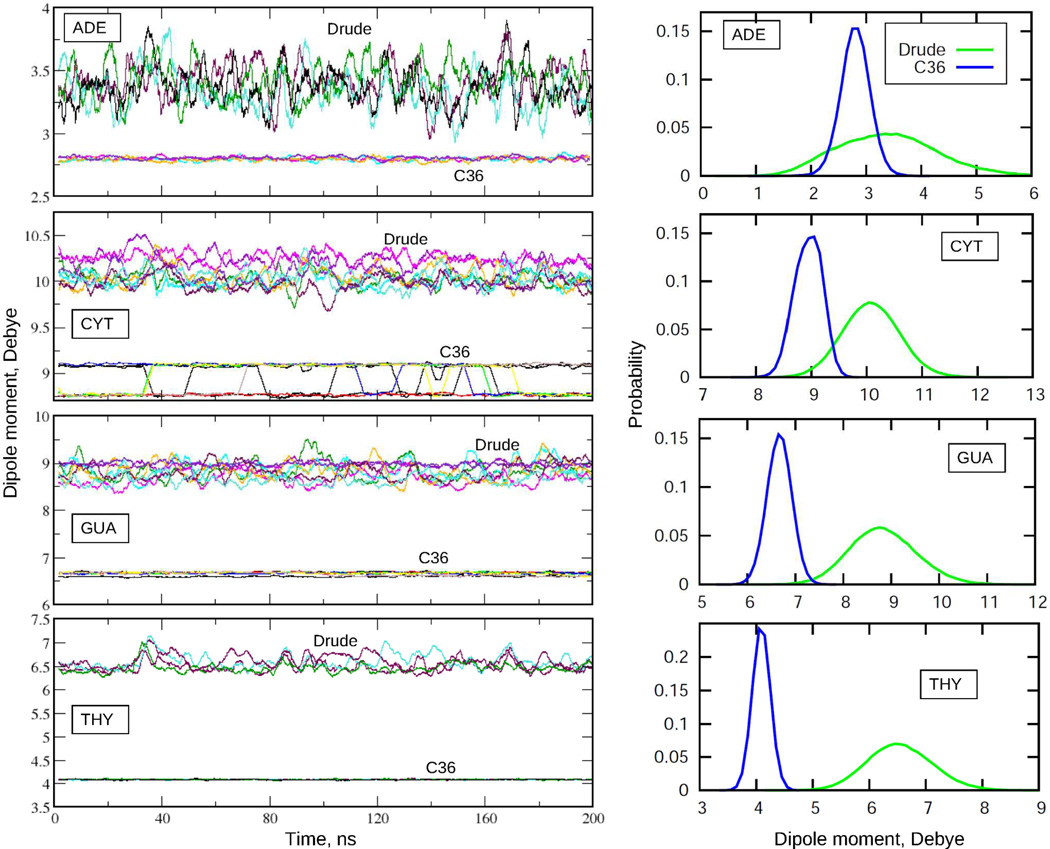
Figure 13.
Dipole moments of the nucleic acid bases as functions of simulation time (left) and the corresponding probability distribution functions (right) from MD simulations of EcoR1 using C36 and Drude force fields. Time series are running averages over 200 windows, each of 1 ns. Distribution functions are from the actual MD simulation time series (time interval 4 ps, bin size for dipole moments 0.1 D). Data presented for 4 adenine, 8 cytosine, 8 guanine, and 4 thymine bases.

