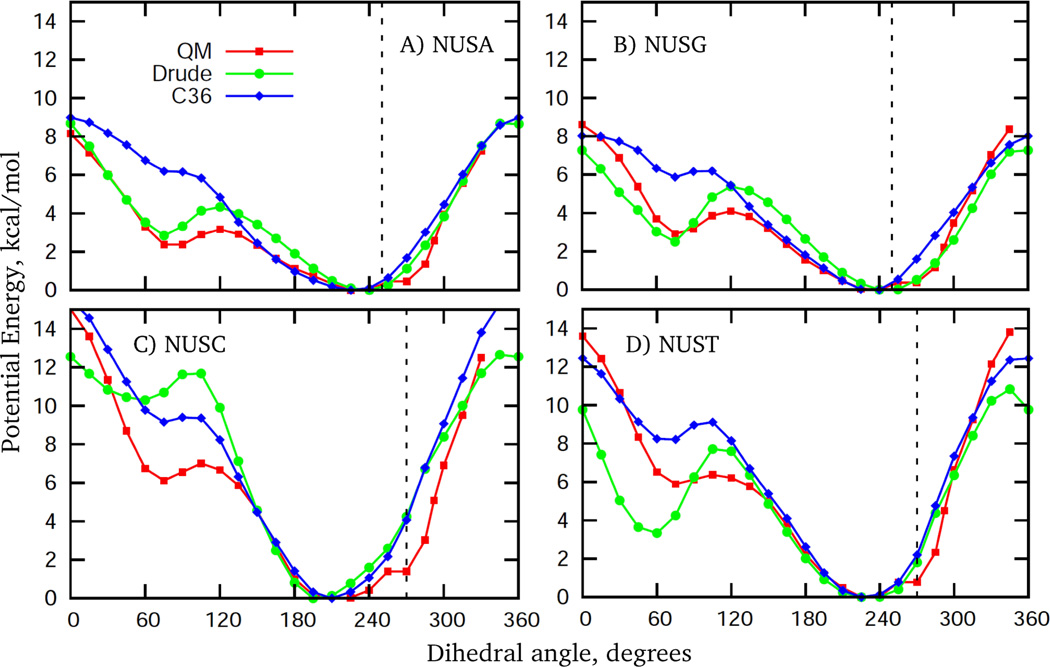
Figure 6.
Potential energy surfaces as a function of the glycosyl torsion χ for model compounds 3–6, with the remaining dihedrals being restrained to conformations corresponding to canonical B form DNA, as elaborated in the Methods section. Vertical dashed lines indicate the position of the maxima in the corresponding dihedral angle distributions from the crystal survey data on all structures in the BI conformation. As in Figure 3, deviations from QM data are attributed to the empirical adjustments of the χ torsions to improve consistency with the crystal survey data, as well with NMR experiments on sugar repuckering in cytosine.

