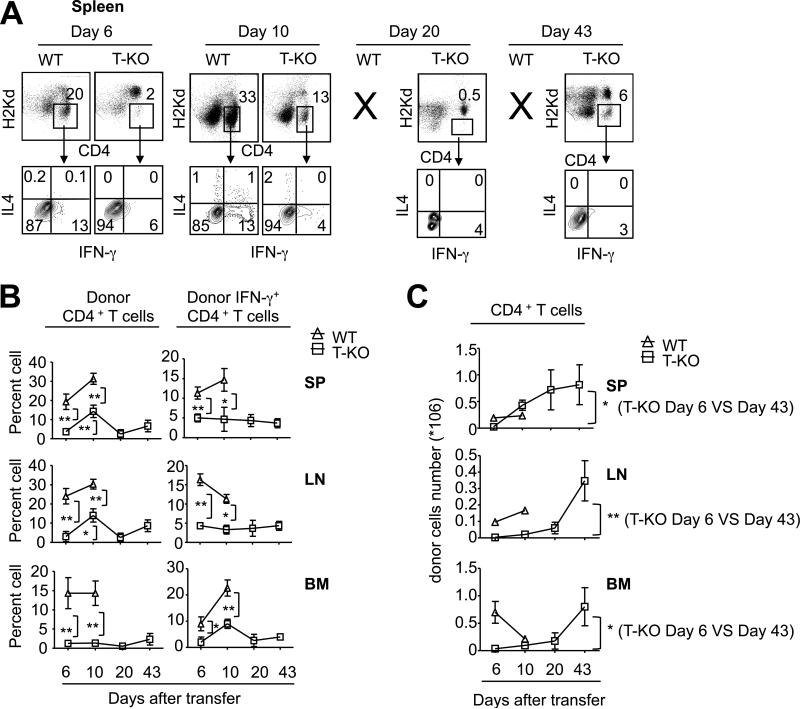
Fig.3. Tracking the longitudinal proliferation and differentiation of transferred WT and T-KO LN cells in vivo.
WT B6 LN (10×106) or T-KO LN (10×106) cells were injected into irradiated BDF1 mice (6.5Gy). Spleen, LN and BM were isolated to measure cytokine production in donor derived CD4+ T cells at day 6, day 10, day 20 and day 43 after transfer, respectively (A-C). (A) Dot plots show the percentage of cytokine-producing donor CD4+ T cells in the spleen. (B) Graphs show the percentage of donor CD4+ T cells (left panel) and donor IFN-γ+CD4+ T cells (right panel). (C) Graphs show the total number of donor CD4+ T cells. Data are representative of two independent experiments with each group containing 4 to 6 mice. Error bars indicate mean ± SD. *, P<0.05, **, P<0.01.

