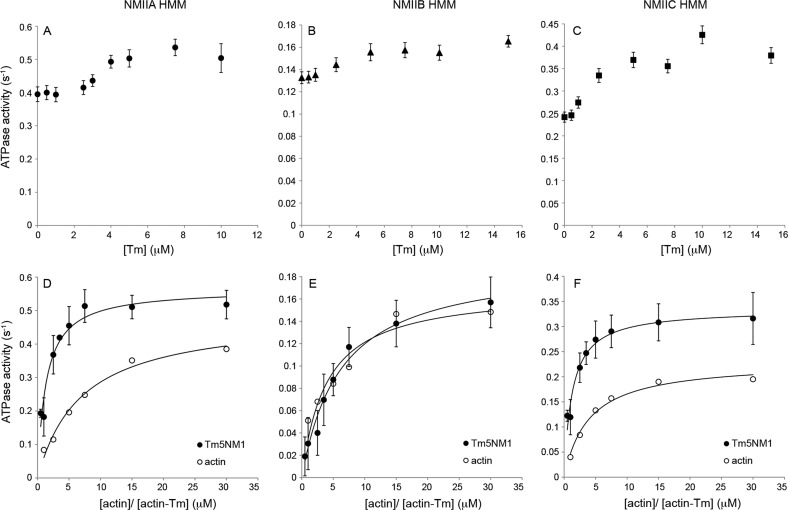
Figure 4.
Actin-activated MgATPase activity of myosins. The steady-state ATPase activity of phosphorylated NMIIA (A and D), NMIIB (B and E), and NMIIC (C and F) HMMs was measured in the presence of (A–C) 15 μM actin and varying concentrations of Tm5NM1 (0–15 μM) or (D–F) varying concentrations of actin and actin–Tm5NM1 (0.5–30 μM) combined at a 1:1 molar ratio. The data in panels D–F were fit to a hyperbolic equation (—) to obtain the values for Vmax and KATPase. Each HMM II protein was at a concentration of 0.1 μM. Each data point is shown with the standard deviation from three or four experiments, and the data without error bars are from a single experiment. The Vmax and KATPase values are listed in Table 2. Assay conditions: 10 mM MOPS (pH 7.0), 2 mM MgCl2, 1 mM ATP, 50 mM KCl, 0.15 mM EGTA, 40 units/mL l-lactic dehydrogenase, 200 units/mL pyruvate kinase, 200 μM NADH, and 1 mM phospho(enol)pyruvate. The temperature was 25 °C.

