
Figure 2. SNV detection and intersection.
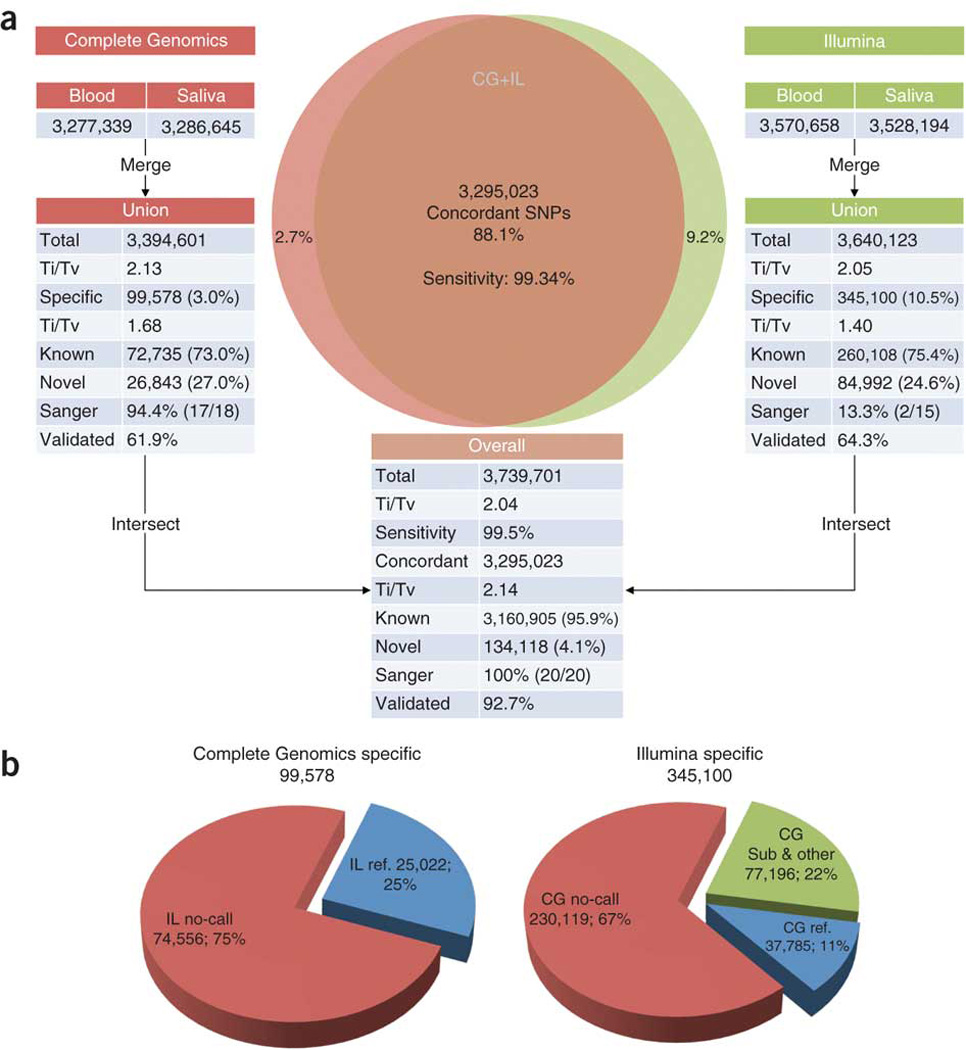
(a) SNVs detected from the PBMC and saliva samples in each platform were combined. The unions of SNVs in each platform were then intersected. Sensitivity was measured against the Illumina Omni array. Ti/Tv is the transition-to-transversion ratio. The known and novel counts were based on dbSNP. ‘Sanger’ and ‘validated’ represent validation by Sanger sequencing and Illumina sequencing (with Agilent target enrichment capture), respectively. (b) Comparing platform-specific SNVs to non-SNV calls in another platform. IL, Illumina; CG, Complete Genomics.