
Figure 2.
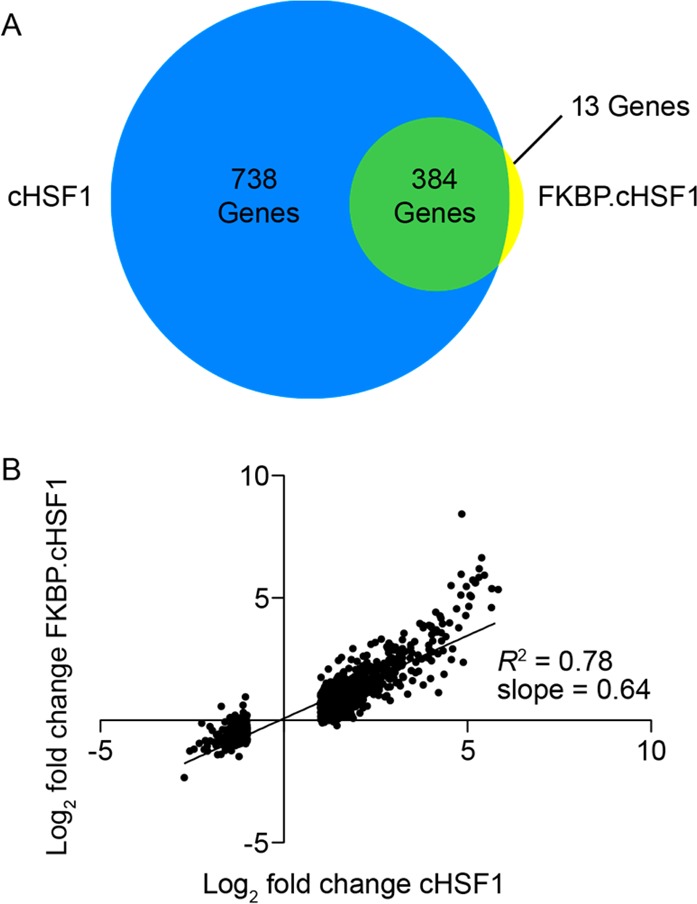
RNAseq transcriptional profiling of stress-independent HSF1 activation. (A) Diagram showing the overlap of genes with >2-fold change (FDR < 0.01) in HEK293T-REx cells following dox-dependent cHSF1 overexpression or Shield-1-dependent FKBP·cHSF1 stabilization. (B) Plot showing the correlation between gene expression in HEK293T-REx cells following Shield-1-dependent FKBP·cHSF1 activation or dox-dependent cHSF1 overexpression. Only genes whose expression is significantly affected (FDR < 0.01) by dox-dependent cHSF1 overexpression are shown.