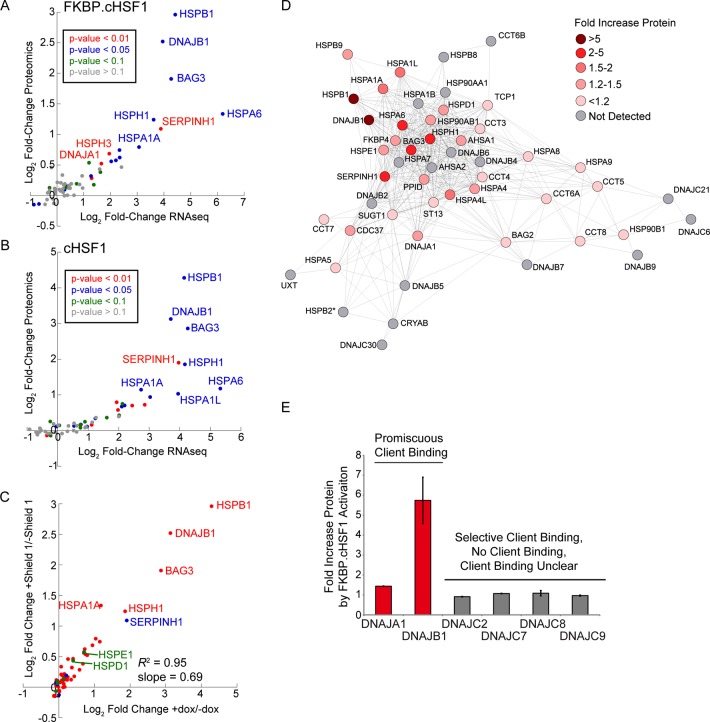
Figure 4.
TMT-MuDPIT shows proteome level remodeling of cytosolic proteostasis pathways induced by stress-independent HSF1 activation. (A) Plot showing the log2 fold change in proteomics vs the log2 fold change in RNAseq for primary proteostasis factors (see Table S3, Supporting Information) in HEK293T-REx cells following Shield-1-dependent FKBP·cHSF1 stabilization. (B) Plot showing the log2 fold change in proteomics vs the log2 fold change in RNAseq for primary proteostasis factors (see Table S3, Supporting Information) in HEK293T-REx cells following dox-dependent cHSF1 overexpression. (C) Plot showing the Shield-1-dependent FKBP·cHSF1 stabilization vs log2 fold change protein levels for proteostasis factors following dox-dependent cHSF1 overexpression. The proteins are colored by intracellular localization: cytosolic/nuclear (red), blue (ER), green (mitochondrial), and membrane-associated (orange). (D) Illustration showing the protein-level remodeling of the highly correlated cellular proteostasis network shown in Figure 3C. (E) Graph showing the fold increase in protein levels of cytosolic HSP40 proteins identified in our TMT-MuDPIT analyses. HSP40 proteins are categorized based on their client binding; promiscuous HSP40s are shown in red, and nonpromiscuous HSP40s are shown in gray.

