
Figure 3.
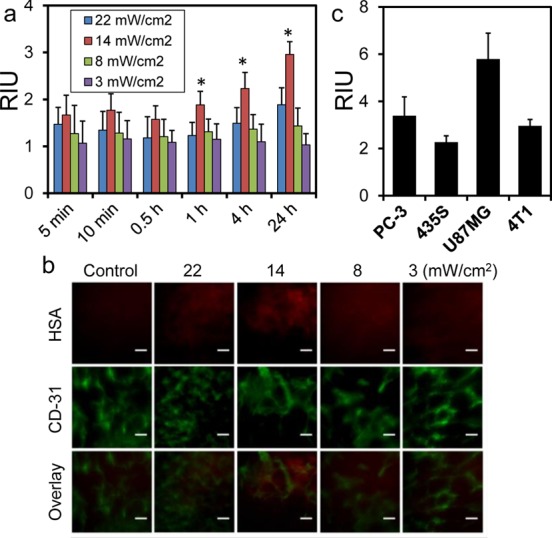
The EPR enhancement is irradiance dependent. (a) Histogram comparison of relatively increased tumor uptake under irradiation at different irradiances. The data were derived from ROI analyses on the in vivo imaging results. The highest RIU values were observed at 14 mW/cm2 for all time points. * indicates p < 0.05. (b) Immunofluorescence staining results. Many more albumins (IRDye800, red) were found outside blood vessels (marked by CD31 staining, green) after the PDT, suggesting an enhanced EPR effect. The most prominent accumulation and dispersion were observed at 14 mW/cm2. Scale bars, 100 μm. (c) EPR enhancement effect in different tumors (n = 3). The results were based on comparison of 24 h tumor accumulation between irradiated and unirradiated tumors. A similar or even superior EPR enhancement effect was observed in PC-3, MDA-MB-435S, and U87MG tumor models.