
Figure 7.
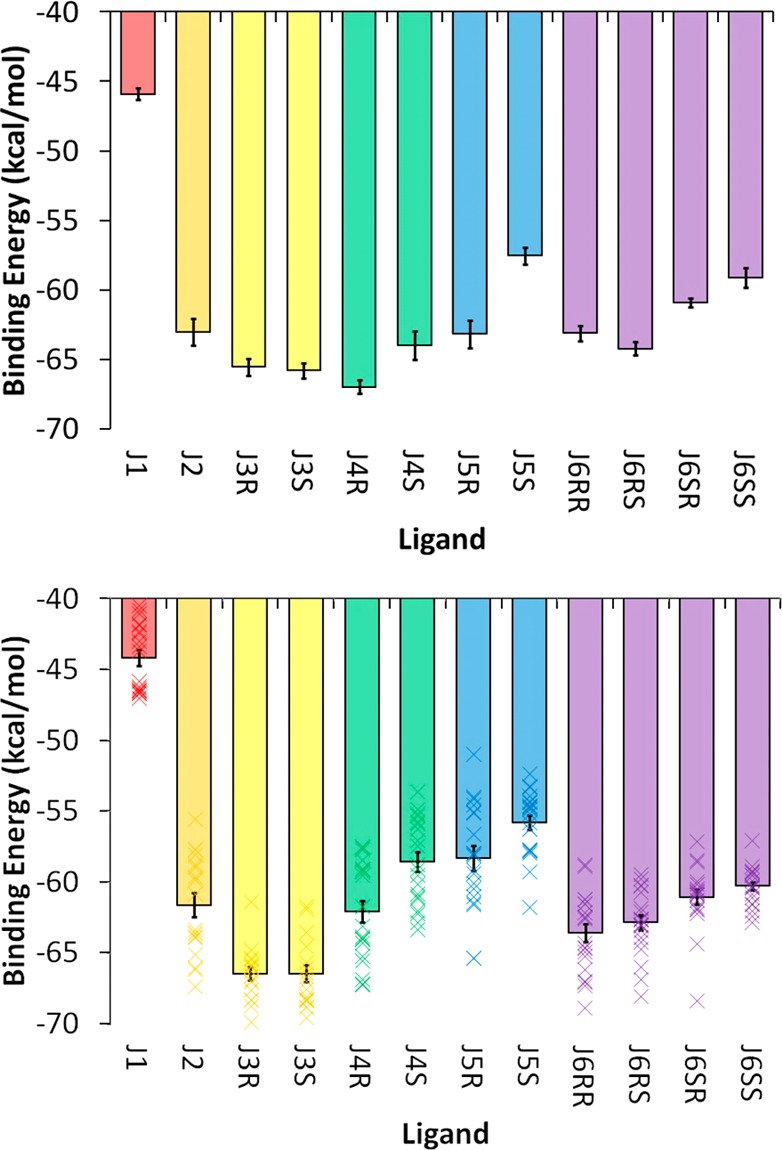
MM-GBSA binding energy results for the (top) CRY1 and (bottom) CRY2 simulation sets. The mean values for the 20 individual CRY2 simulations are depicted by the “×” symbols (bottom), whereas the bar shows the overall mean value. All of the data are in units of kcal/mol, and the specific values for both panels are given in SI Table S4. Stereoisomers/diastereomers are grouped by color.