
Figure 8.
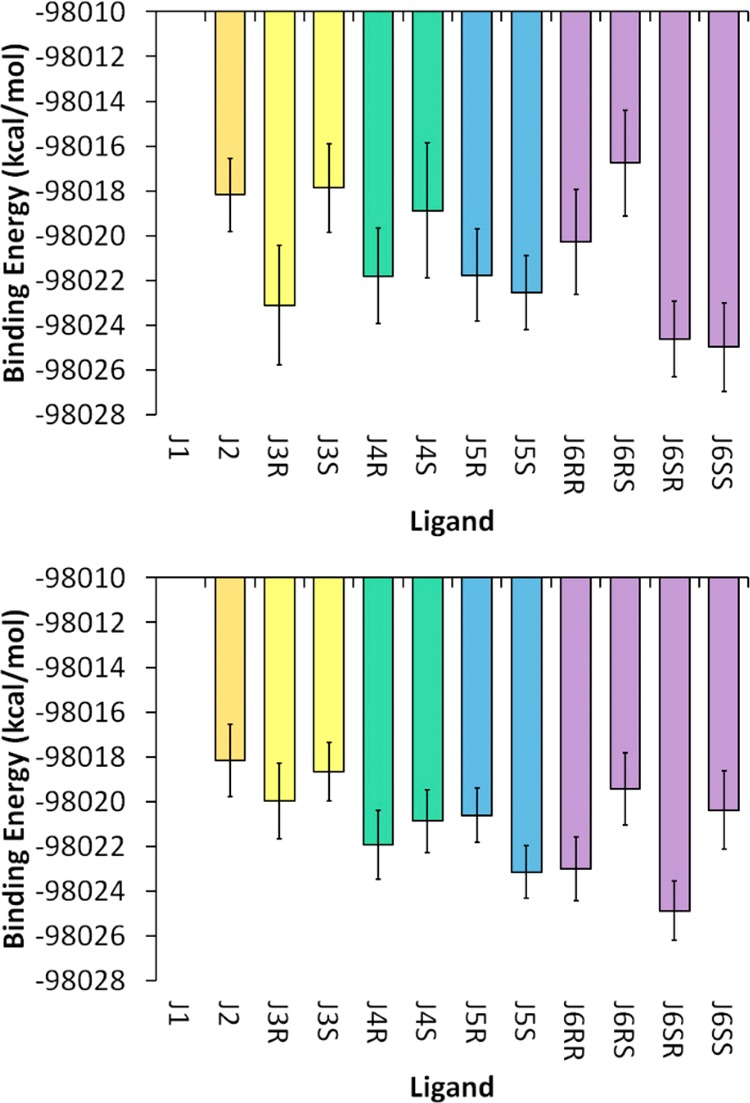
Relative binding enthalpies calculated using the solvated potential energy difference (see the text) from the (top) CRY1/LIG and (bottom) CRY2/LIG simulation sets. Data for the J1 inhibitor are not shown because it has a different charge than the rest of the inhibitors, which prevents a direct comparison of the results. All of the data are in units of kcal/mol, and the specific values for both panels are given in SI Table S5. Stereoisomers/diastereomers are grouped by color.