
Figure 9.
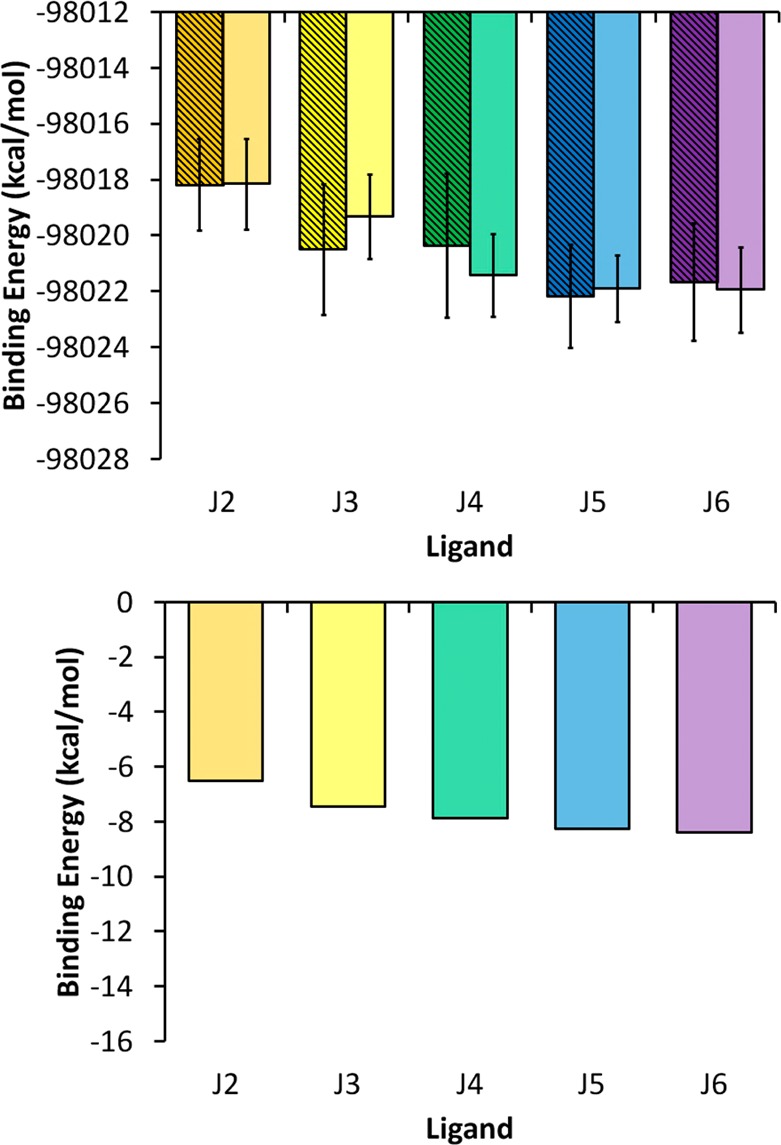
(top) Stereochemically averaged relative binding energies calculated using the solvated potential energy difference (see the text) for the CRY1/LIG (striped bars) and CRY2/LIG (solid bars) simulation sets. Data for the J1 inhibitor are not shown because it has a different charge than the rest of the inhibitors, which prevents a direct comparison of the results. (bottom) Previously reported experimental binding energies.18 All of the data are in units of kcal/mol, and the specific values for both the top and bottom charts are given in SI Table S6. Color scheme follows Figures 7 and 8