
Figure 6.
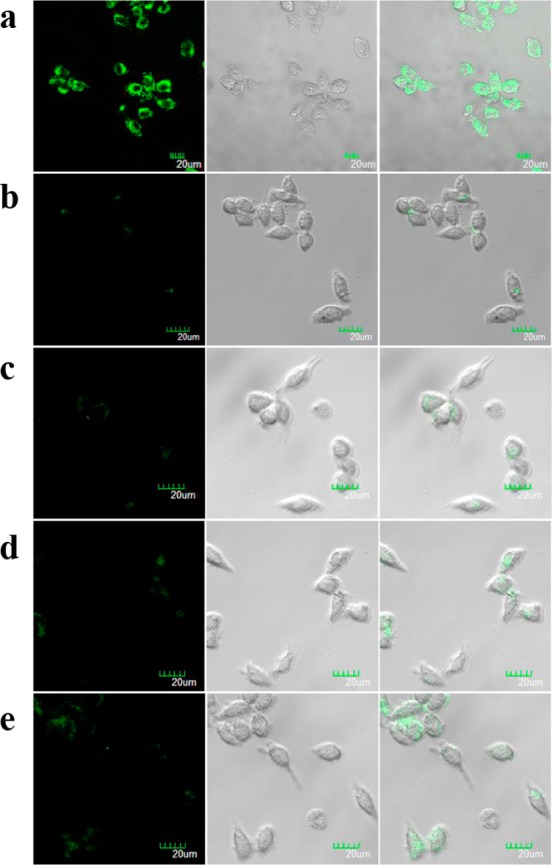
Confocal fluorescence microscopy images of MCF-7 cells treated with (a) 100 mM l-histidine, 150 mM K+, and 60 nM active G4-l-histidine; (b) 100 mM l-histidine, 150 mM K+, and 60 nM in active G4-l-histidine-R; (c) 60 nM active G4-l-histidine; (d) 100 mM l-histidine and 60 nM active G4-l-histidine; (e) 150 mM K+ and 60 nM active G4-l-histidine. The green channel is FAM fluorescence. Differential interference contrast (DIC) microscopy images of cells are shown in the second column. Overlap of fluorescence and DIC images are shown in the third column. Scale bar = 20 μm.