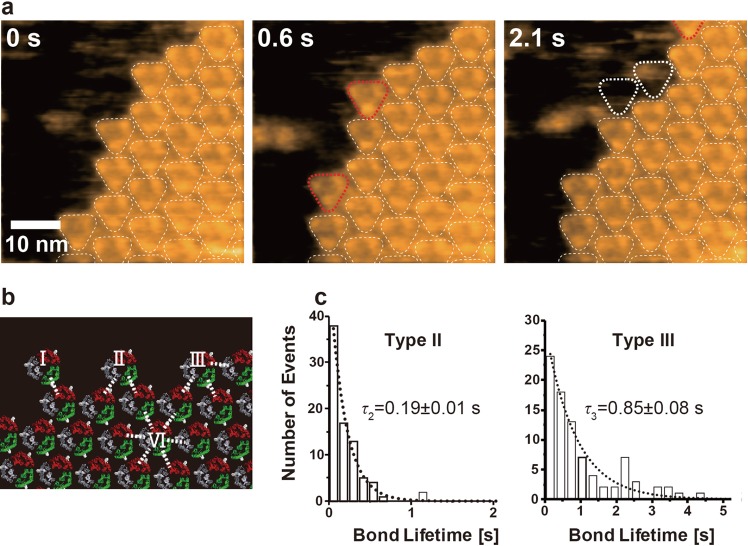
Figure 29.
Association and dissociation of bR molecules at crystal edges captured by HS-AFM. (a) Clips of successive HS-AFM images on the borders between the bR crystal and noncrystalline areas (imaging rate, 3.3 fps). The bR trimers in the crystal are encircled by thin lined triangles. Newly bound (0.6 s) and dissociated (2.1 s) trimers are indicated by red and thick lined white triangles, respectively. (b) Schematic representing the binding manner of a trimer at the crystal edge (I, II, and III) and in the crystal interior (VI). Roman numerals indicate the number of interaction bonds (dotted lines) containing W12 residue. (c) Histograms showing lifetimes for the type II and III binding events. The histograms were fitted with single-exponential functions (dotted lines).

