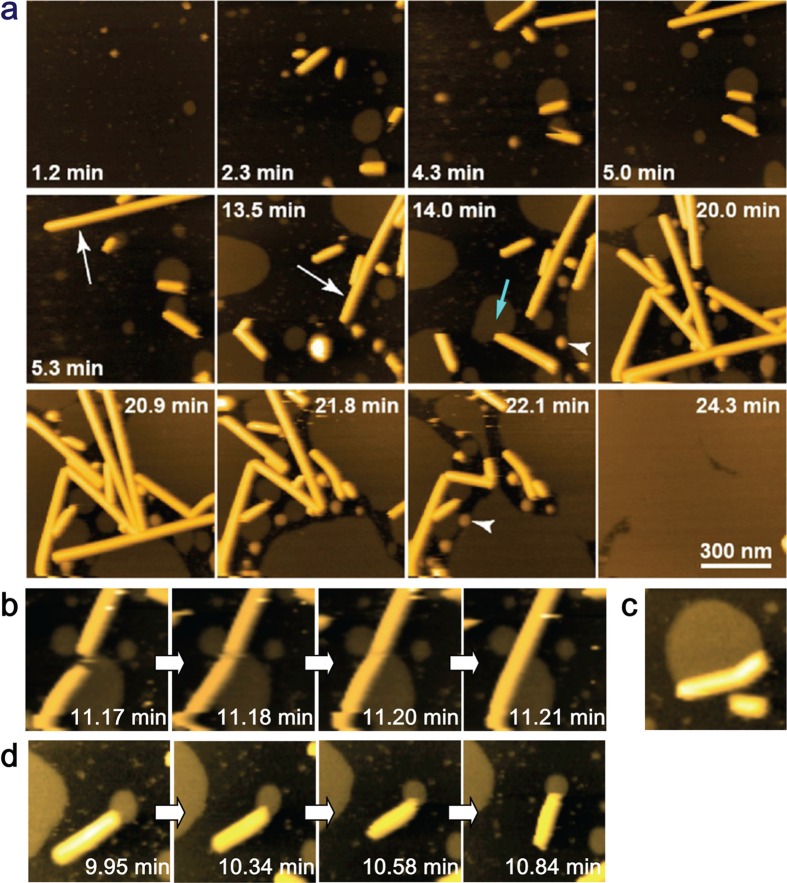
Figure 38.
HS-AFM imaging of dynamic events occurring in the process of SLB formation on mica. (a) Clips of successive HS-AFM images captured at 1.03 fps for a scan size of 800 × 800 nm2 over 25 min (Z color scale, 25 nm). The white arrows indicate rapidly growing lipid nanotubes with ∼20 nm height. The light-blue arrow indicates the interaction between a patch of SLB and one end of a lipid nanotube. The arrowheads indicate liposomes with 7.5–30 nm. (b) Successive HS-AFM images showing fusion of two lipid nanotubes at the ends. (c) A HS-AFM image showing bending of a nanotube interacting with the sideways edge of a SLB patch at the longitudinal side. (d) Clips of successive HS-AFM images showing the interaction of a lipid nanotube with the edge of SLB patch at one of the ends. The size of the SLB patch is getting smaller, while the length of the nanotube is becoming shorter.

