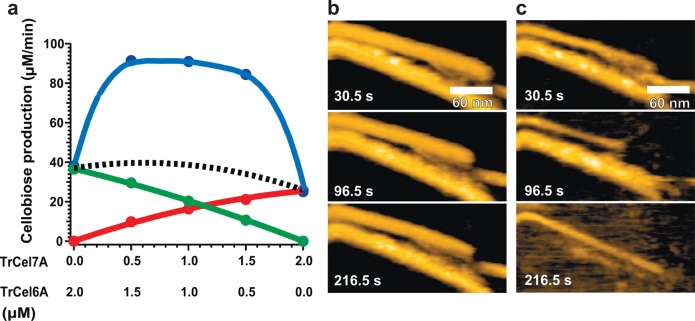
Figure 41.
Synergistic hydrolysis by TrCel6A and TrCel7A visualized by HS-AFM. (a) Synergy, measured biochemically, between TrCel6A and TrCel7A in cellobiose production from cellulose IIII. The green and red plots show the rates of cellobiose production by TrCel6A alone and TrCel7A alone, respectively, and the blue plot shows the synergy between the two enzymes. The dotted line indicates the simple sum of cellobiose production calculated from the green and red plots. (b) Clips of successive AFM images of cellulose IIII after injection of TrCel6A at 0 s. The degradation of cellulose was not discernible even at 8 min. (c) Clips of successive AFM images after the additional addition of TrCel7A at 0 s (at 8.4 min after the initial addition of TrCel6A). The cellulose was rapidly degraded and almost disappeared at 8 min. Imaging rate, 3.3 fps for (b) and (c).

