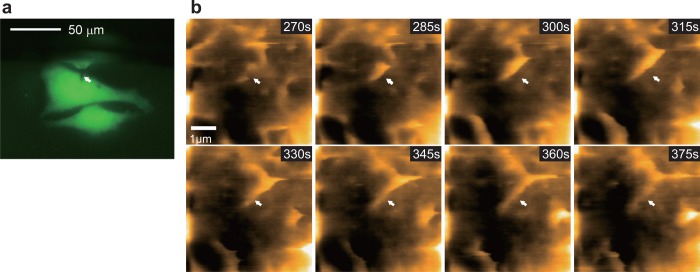
Figure 49.
Dynamics occurring on the apical surface of HeLa cell captured by HS-AFM. (a) Fluorescence microscopic image of GFP-transfected HeLa cells. The cantilever is indicated by the white arrow. (b) Clips of successive HS-AFM images of the apical surface of a live HeLa cell. Growth of a filopodium is indicated by arrows. Scan range, 5 × 5 μm2; imaging rate, 0.2 fps; pixels, 200 × 200.

