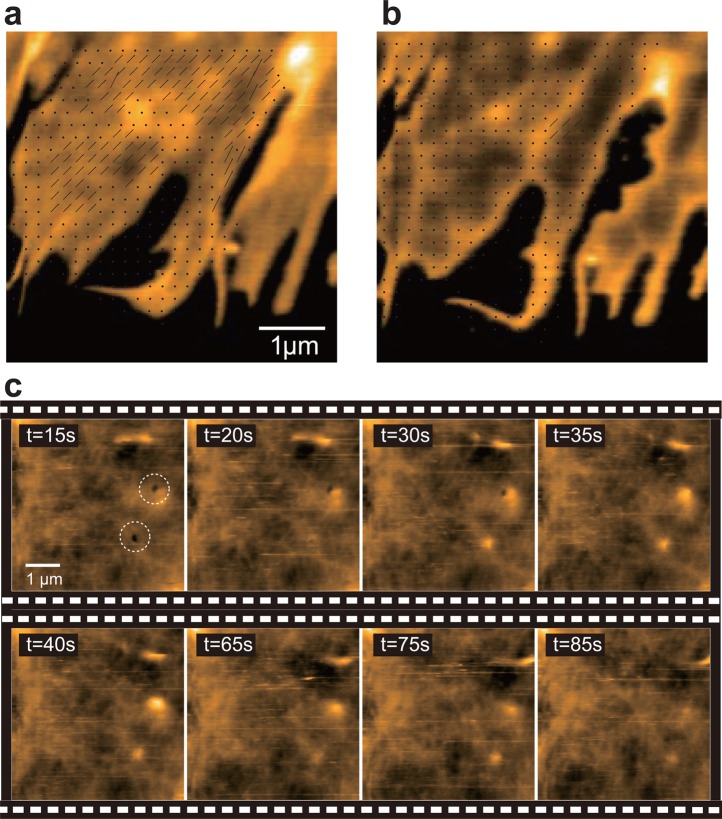
Figure 50.
Dynamics observed by HS-AFM on the peripheral surface of HeLa cell. (a,b) Topographic image of HeLa cell at an peripheral region (a) before and (b) after the addition of cytochalasin D. Thin black lines in (a) indicate flow of small objects. Black dots in (b) show that no flow is occurring. Scan range, 5 × 5 μm2; imaging rate, 0.2 fps; pixels, 200 × 200. (c) Clips of successive images showing the process of endocytosis. Initially formed pits are highlighted by the dotted circles. Scan range, 5 × 5 μm2; imaging rate, 0.2 fps; pixels, 200 × 200.

