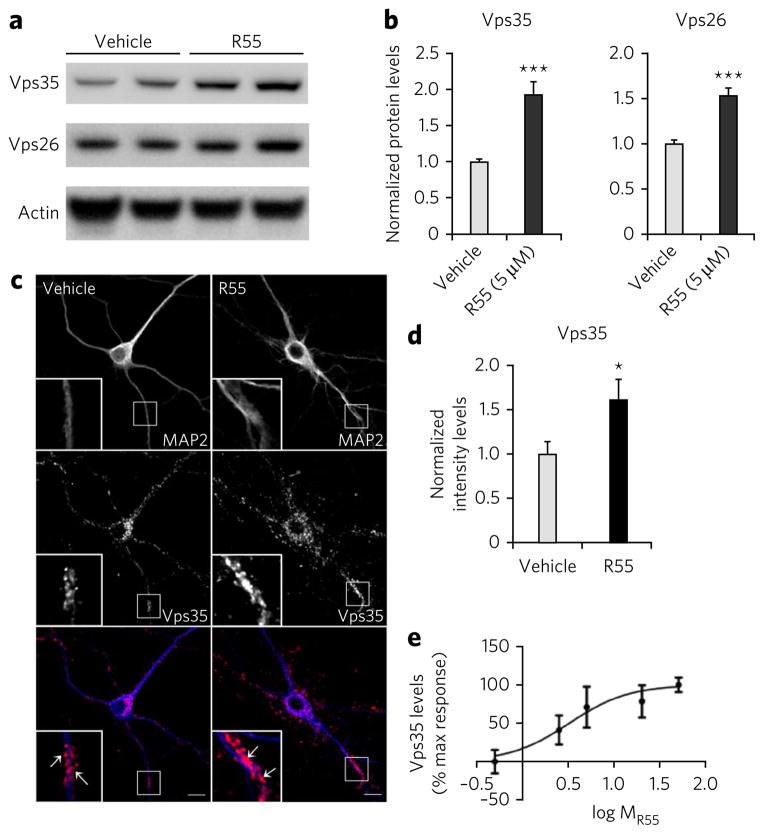
Figure 3. The pharmacological chaperone increases retromer levels in neurons.
(a) Left panel, representative western blots of the effect of R55 (5 μM for 48 h) and vehicle on levels of Vps26 and Vps35 in 2-week-old primary cortical neuronal cultures derived from WT mice. (b) Quantitative analysis of the blots. Levels of Vps26 and Vps35 were normalized to total levels of actin (n = 9 per group, P < 0.001). Comparable results were obtained when tubulin was used a control (data not shown). (c) Primary hippocampal neurons were analyzed by confocal microscopy after labeling for MAP2 (blue) and Vps35 (red). Arrows indicate structures showing Vps35 labeling. Scale bars, 10 μm. (d) Bar graph showing a quantitative analysis of Vps35 intensity staining. Levels of Vps35 were normalized to total cell area (n = 14 cells per group). (e) Dose-response curve of the effect of R55 on Vps35 levels performed by western blot analysis (concentration of 0.5 μM, 2.5 μM, 5 μM, 20 μM and 50 μM were used, n = 8 per time point). Results here and in the following figures are shown as mean values ± s.e.m., where *P < 0.05, **P < 0.01 and ***P < 0.005, determined using Student’s t-test.

