Figure 3.

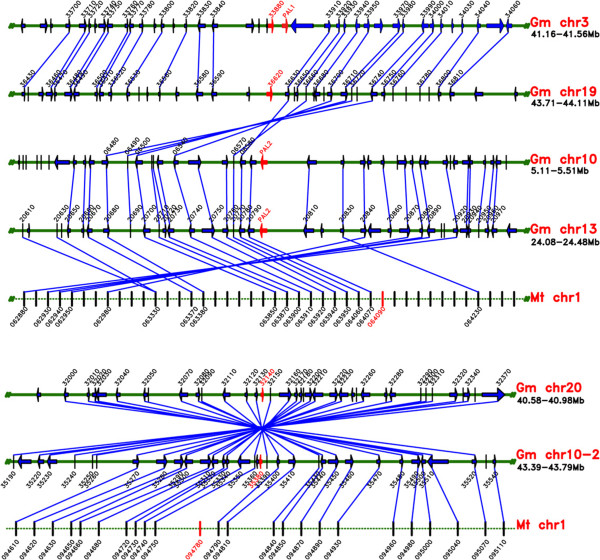
Synteny analyses for the PAL gene family. Green solid and dotted lines represent soybean and M. truncatula chromosomes, respectively. Target genes are indicated by red arrows.

Synteny analyses for the PAL gene family. Green solid and dotted lines represent soybean and M. truncatula chromosomes, respectively. Target genes are indicated by red arrows.