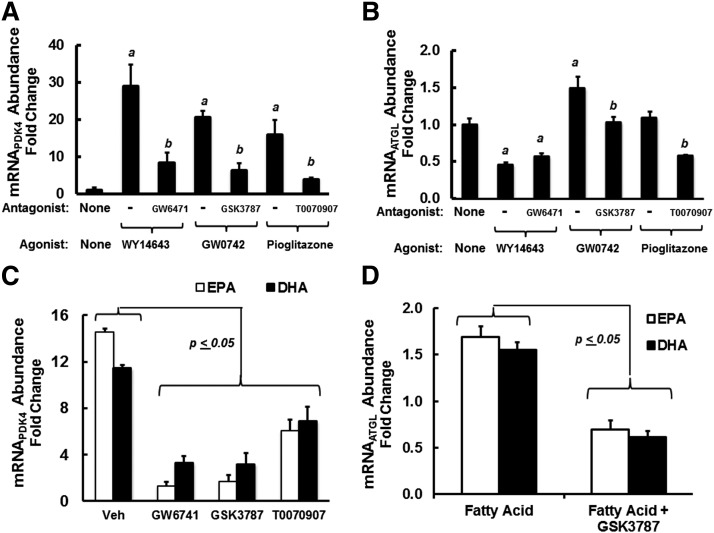
Fig. 10.
Role of PPAR (α, β, and γ) in the FA regulation of PDK4 and ATGL in HepG2 cells. Preliminary dose response studies established the effective dose (ED50) for induction and inhibition of PDK4 expression by PPAR agonists and antagonists, respectively. Using these concentrations, we assessed the PPAR agonist/antagonist effects on PDK4 and ATGL mRNA abundance in HepG2 cells. A and B: HepG2 cells were treated with PPARα, PPARβ, and PPARγ agonist at 10 μM WY14643, 400 nM GW0742, and 1 μM pioglitazone, respectively. Each group was also treated with the following PPAR antagonists (the PPAR antagonist concentration used was 4× the 50% inhibitory dose defined in preliminary studies): PPARα antagonist, GW6471 (1 μM); PPARβ antagonist, GSK3787 (1 μM); and PPARγ antagonist, T0070907 (4 nM). Cells were treated with agonist without and with antagonist for 48 h. Results are presented as mRNA abundance fold change for PDK4 (A) and ATGL (B); mean ± SD, n = 3. a, P ≤ 0.05, PPAR agonist versus no treatment; b, P < 0.05, PPAR antagonist versus PPAR agonist; Student’s t-test. C and D: HepG2 cells were treated with EPA or DHA at 100 μM in the absence or presence of PPARα antagonist, GW6471 (1 μM); PPARβ antagonist, GSK3787 (1 μM); or PPARγ antagonist, T0070907 (4 nM). As above, cells were harvested 48 h later for RNA extraction and quantitation of PDK4 (C), ATGL (D), and cyclophilin. Results are expressed as mRNA abundance fold change from cells treated with no FA; mean ± SD, n = 3. The comparison is between FA-treated cells versus FA + PPAR selective antagonist-treated cells; Student’s t-test.

