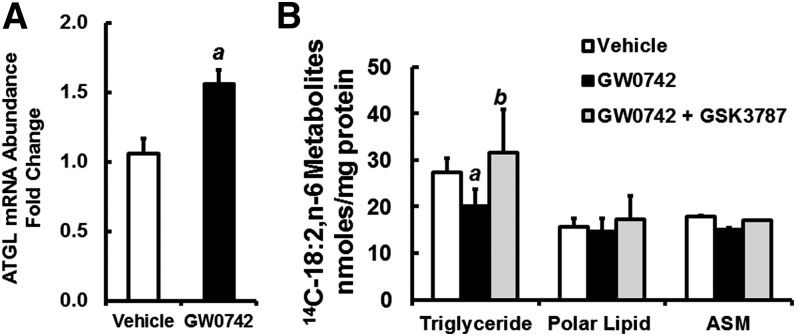
Fig. 11.
Effect of PPARβ agonist and antagonist on ATGL expression and lipid metabolism in AML12 cells. A: AML12 cells at ∼80% confluence were treated with vehicle (0.1% ethanol) or GW0742 (400 nM) for 48 h. RNA was isolated to measure ATGL and cyclophilin. Results are expressed as ATGL mRNA abundance fold change; mean ± SD, n = 4. a, P < 0.05 versus vehicle-treated cells. B: AML12 cells were treated with vehicle, GW0742 (400 nM), or GW0742 (400 nM) + GSK3787 (1 μM) for 48 h. Cells were treated with 100 μM 14C-18:2,n-6 for 6 h in serum-free DMEM/F12 medium containing BSA (33 μM). After FA treatment, cells were recovered for total protein measurement and total lipid extraction. Media was recovered for the measurement of FAO as ASM as described (22). Total lipids were separated by TLC, and the distribution of 14C in various lipids was quantified by phosphorimage analysis as described (22). Results are represented as 14C-18:2,n-6 metabolites (as TGs, polar lipids, or ASM), nanomoles per milligram of protein; mean ± SD, n = 4. a, P < 0.05 versus vehicle-treated cells; b, P < 0.05 versus GW0742-treated cells; Student’s t-test.

