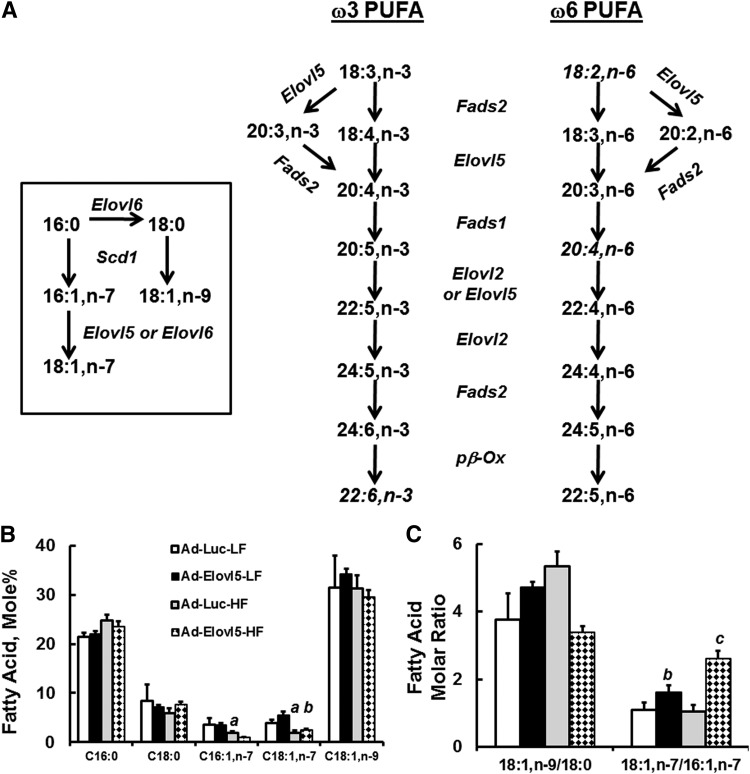
Fig. 8.
Elevated hepatic Elovl5 activity changes hepatic MUFA and PUFA content. A: Pathways showing involvement of Elovl5 in MUFA and PUFA synthesis. B: Effect of diet and Elovl5 on hepatic saturated (SFA) and MUFA content. Results are expressed as mole %, mean ± SD, n = 4. C: Mole ratio of 18:1,n-9 to 18:0 and 18:1,n-7 to 16:7,n-7. D: Sum of C20 and C22 FAs in livers of LFD- and HFD-fed mice infected with Ad-Luc or Ad-Elovl5. Results are given as the sum of the mole % of 20- or 22-carbon FAs. E: The ratio of the sum of all n-3 PUFAs to the sum of all n-6 PUFAs in livers of LFD- and HFD-fed mice infected with either Ad-Luc or Ad-Elovl5. F: Diet and Elovl5 effects on the mole % of 18:2,n-6 and 20:4,n-6. Inset: Mole ratio of 20:4,n-6 to 18:2,n-6. G: Diet and Elovl5 effects on the mole % of 18:3,n-6, 20:3,n-6, 22:4,n-6, and 22:5,n-6. H: Diet and Elovl5 effects on the mole % of 18:3,n-3, 20:5,n-3, 22:5,n-3, and 22:6,n-3. I: Mole ratio of 20:4,n-6 to 18:2,n-6; 20:5,n-3 to 18:3,n-3; and 22:5,n-3 to 18:3,n-3. J: Mole ratio of 22:6,n-3 to 18:3,n-3. All results are the mean ± SD, n ≥ 4/group. a, P ≤ 0.05 versus Ad-Luc-infected mice fed the LFD (diet effect); b, P ≤ 0.05 versus Ad-Luc-infected mice fed the LFD or HFD (genotype effect); c, P ≤ 0.05 versus Ad-Elovl5-infected mice fed the LFD (diet-genotype interaction); two-way ANOVA with post hoc HSD test.


