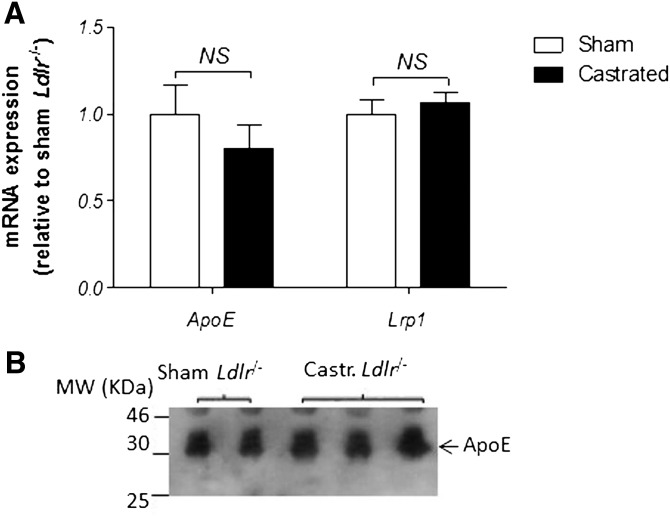
Fig. 5.
Fold change in gene expression of Lrp1 and ApoE genes (A) in sham-operated and castrated Ldlr−/− mice (n = 12). The values of both sham and castrated mice were relative to those of the internal control gene Rps18. The values of the castrated mice represent the fold change relative to that of sham-operated mice (defined as 1). The fold-change in Lrp1 and ApoE gene expression was not statistically significant (both P > 0.05) using a two-tailed unpaired Student’s t-test. Shown in B is a representative Western blot analysis of plasma ApoE protein levels in sham-operated and castrated Ldlr−/− mice.

