Fig. 1.
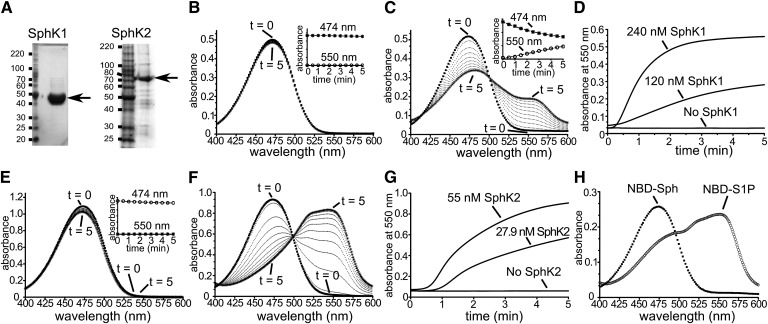
SphK1- and SphK2-dependent changes in NBD-Sph visible absorption spectra. A: SDS-PAGE analysis of purified recombinant SphK1 and SphK2 stained with Coomassie brilliant blue G250. B, E: Absorption spectra of NBD-Sph (30 µM) in SphK1 buffer containing 0.05% Triton X-100 and 100 nM SphK1 but lacking ATP (B), or NBD-Sph (60 µM) in SphK2 buffer containing 0.07% Triton X-100, 200 mM KCl, and 100 nM SphK2 but lacking ATP (E). Spectra were recorded every 30 s for 5 min. Insets: Absorbances at 474 nm and 550 nm are unchanged. C, F: Time-resolved scanning absorption spectra of reaction mixtures in B or E after addition of 1 mM ATP. D, G: Time-resolved changes in absorbance at 550 nm of SphK1 (D) or SphK2 (G) assay mixtures containing the indicated concentrations of SphK1 or SphK2, respectively. H: Absorption spectra of NBD-Sph (12.5 µM) and NBD-S1P (12.5 µM) in assay buffer containing 0.05% Triton X-100.

