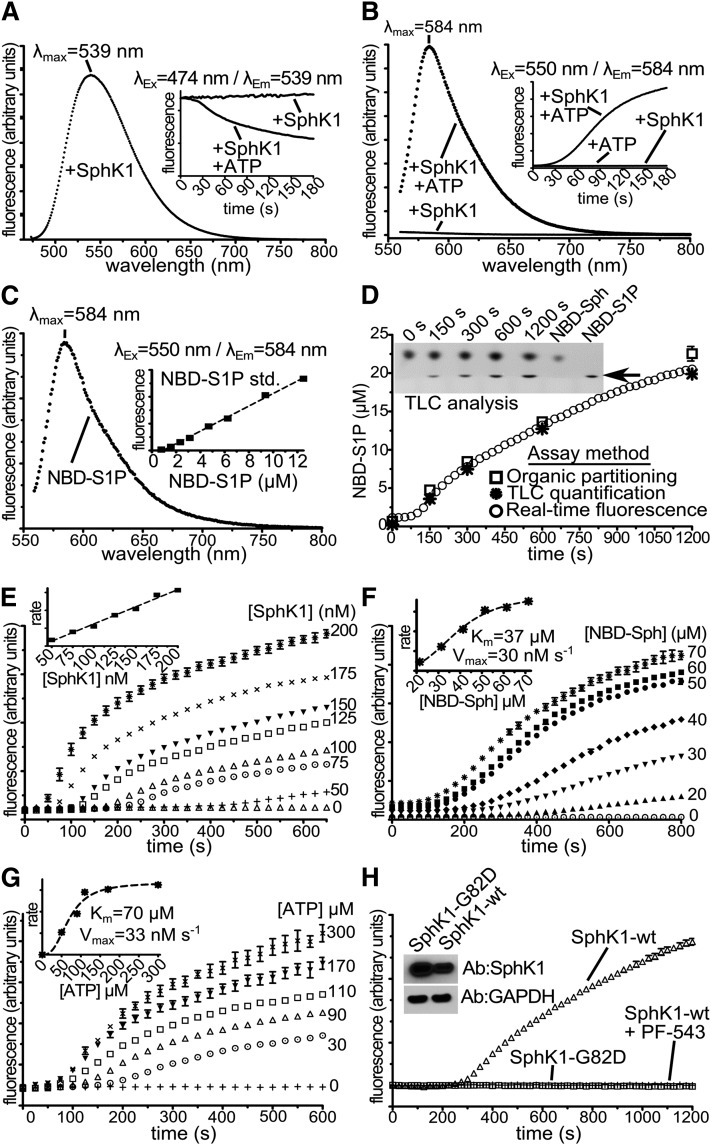
Fig. 2.
SphK1 activity-dependent changes in NBD-Sph fluorescence emission. A–C: λEx = 474 nm (A) or λEx = 550 nm (B, C) fluorescence emission spectra of NBD-Sph (A, B) (30 µM) or NBD-S1P (C) (25 µM) at 25°C in SphK1 reaction buffer containing 0.05% Triton X-100, 100 nM SphK1 (A, B), without or with ATP as indicated (A, B). Insets: Time-resolved fluorescence emission with λEx = 474 nm/λEm = 539 nm (A) or λEx = 550 nm/λEm = 584 nm (B) in the absence or presence of 1 mM ATP as indicated, or λEx = 550 nm/λEm = 584 nm (C) emission of NBD-S1P standards (n = 3). D: Parallel reactions at 37°C with 50 µM NBD-Sph, 150 nM SphK1, 1 mM ATP, and 0.1% Triton X-100 were monitored by TLC (4), organic partitioning (10), or with time-resolved fluorescence emission (λEx = 550 nm/λEm= 584 nm), and turnover determined with a NBD-S1P standard curve. n = 3. Initial rates for λEx = 550 nm/λEm= 584 nm emission were calculated from 125 to 400 s. E–G: Time-resolved fluorescence emission at 37°C with λEx = 550 nm/λEm= 584 nm of reactions containing 0.1% Triton X-100, 1 mM ATP (E, F), 50 µM NBD-Sph (E, G), 150 nM SphK1 (F, G), and increasing SphK1 (E), NBD-Sph (F), or ATP (G) concentrations. n = 3 (E); n = 4 (F); n = 3 (G). Insets: Initial rates versus [SphK1] (E), initial rates versus [NBD-Sph] (F), and initial rate versus [ATP] (G) plots. H: λEx = 550 nm/λEm= 584 nm time-resolved fluorescence emission at 37°C of reactions containing 0.1% Triton X-100, 1 mM ATP, 1.2 µg of lysates from HEK293T cells overexpressing SphK1-WT with or without 250 nM PF-543 as indicated, or catalytically inactive SphK1-G82D. Inset: Immunoblots of extracts probed with the indicated antibodies. Experiments in D–H were performed in 384-well 20 µl format in a fluorescence plate reader.

