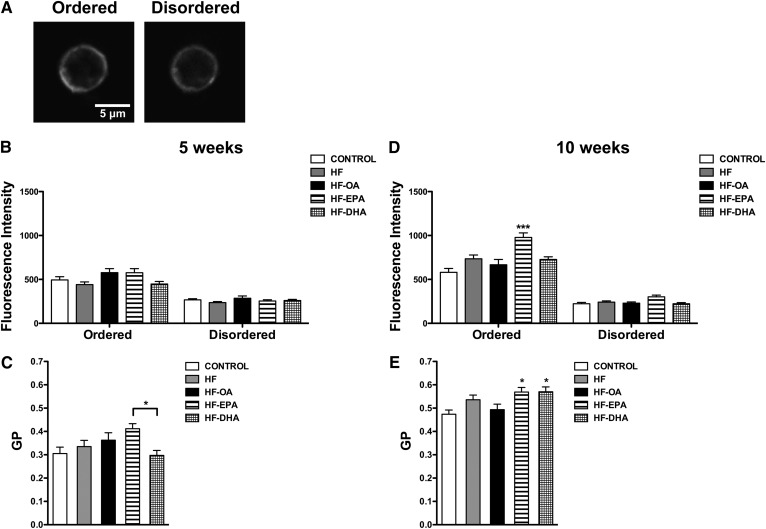
Fig. 6.
B-cell plasma membrane molecular organization is differentially elevated with EPA and DHA. Splenic B220+ B cells were isolated from C57BL/6 mice consuming control, HF, HF-OA, HF-EPA, or HF-DHA diets for 5 or 10 weeks and stained with Laurdan. A: Sample images of Laurdan used to measure fluorescence intensities in the ordered (400–460 nm) and disordered (495–540 nm) channels and to calculate GP. Fluorescence intensities in the ordered and disordered channels (B) and GP values after 5 weeks of intervention (C). Fluorescence intensities in the ordered and disordered channels (D) and the associated GP values after 10 weeks of intervention (E). Data are average ± SE from four to five animals per diet. Asterisks indicate significance from control unless indicated by a bracket: *P < 0.05, ***P < 0.001.

