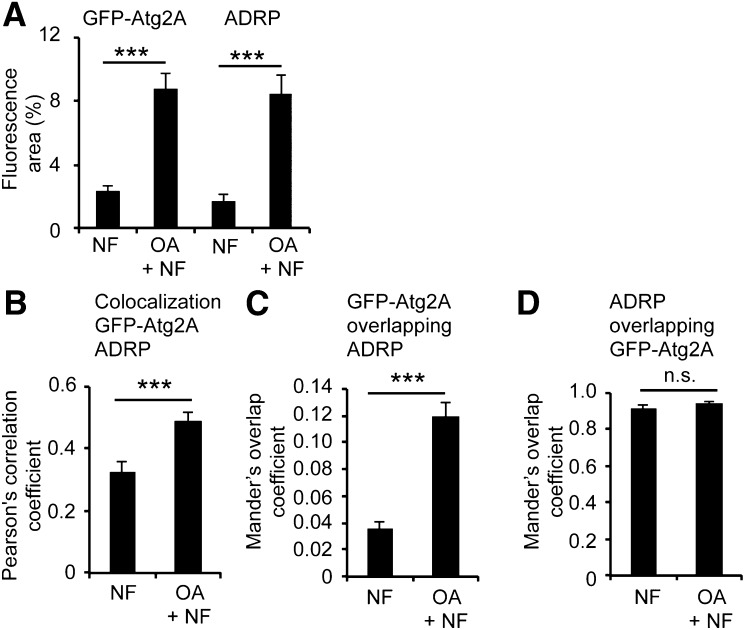
Fig. 3.
OA treatment increased Atg2A targeting to ADRP-positive LDs. G361 cells transiently expressing GFP-Atg2A were incubated with or without OA for 24 h, followed by treatments with NF medium for 3 h. Cells were immunostained with anti-ADRP/IgG Alexa 546 antibodies analyzed by confocal LSM (n = 3). A: Image projections of confocal sections were quantified with regard to fluorescence areas by using Image Pro Plus, providing the percentage of the total inclusion area (ADRP or GFP-Atg2A vesicles) in relation to the total cell area. NF, n = 21 cells; OA + NF, n = 18 cells (from 3 independent experiments). B: Using the ImageJ colocalization threshold tool, the PCC for individual cells (n = 34 cells per treatment) was measured. The MOC for GFP-Atg2A overlapping with ADRP (C) and ADRP overlapping with GFP-Atg2A (D) was also measured using the ImageJ colocalization threshold. Mean ± SEM. P values: n.s. (not significant) P ≥ 0.05, *** P ≤ 0.001. Supporting material is available (supplementary Fig. IIIB).

