
Fig. 6.
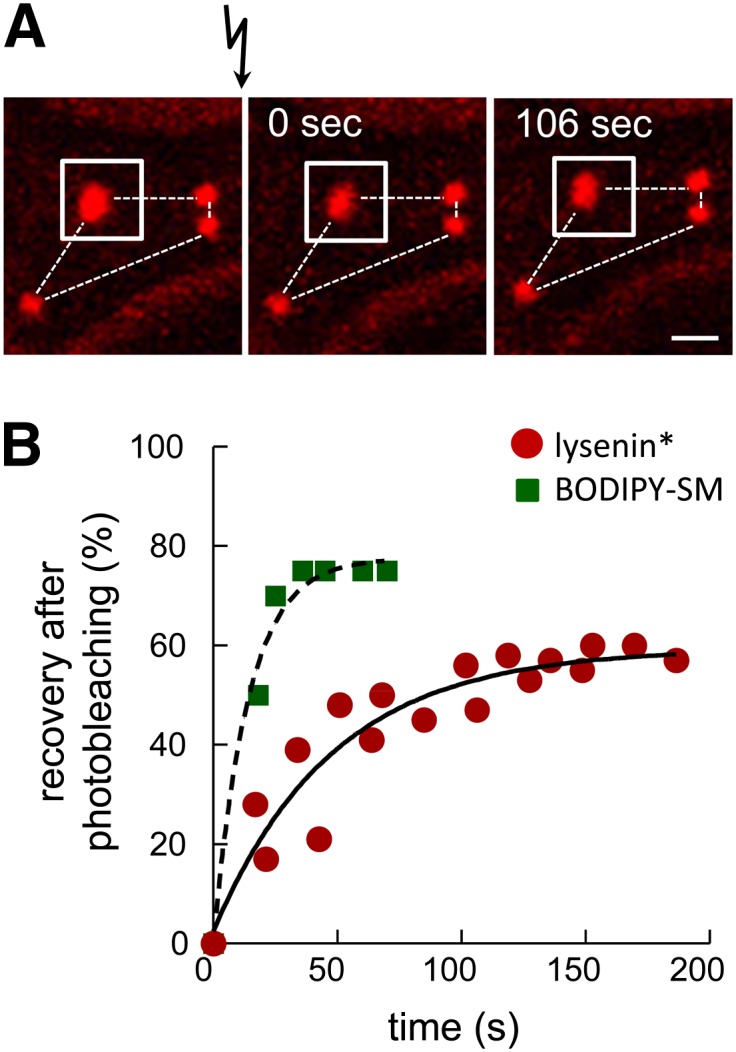
Endogenous SM submicrometric domains assume fixed position but exchange their constituents. Analysis by FRAP at 37°C in ∼2.5 μm2 fields centered on endogenous SM submicrometric domain [white squares in (A)] at the indicated time intervals after photobleaching. A: Representative vital imaging. Flash arrow indicates bleaching of area shown by the white squares. As expected, mCherry is only partially (<50%) photobleached. Notice the immobility in the space of all domains (fixed positions as in constellations, dotted lines). Scale bar, 1 μm. B: Quantification. Red circles, lysenin* (means of five bleached domains from two independent experiments); green squares, BODIPY-SM [reproduced from (11) for comparison purposes]. Fluorescence recovery is expressed as percentage of signal before photobleaching, after correction of residual fluorescence immediately after bleaching. Curves derived by monoexponential fitting. As compared with BODIPY-SM domains (green squares, t1/2 ∼10 s; ∼75% maximal recovery), notice the expected slower (t1/2 ∼33 s) and decreased fluorescence recovery (∼60% at infinite time) of endogenous SM domains decorated by lysenin* (red circles).