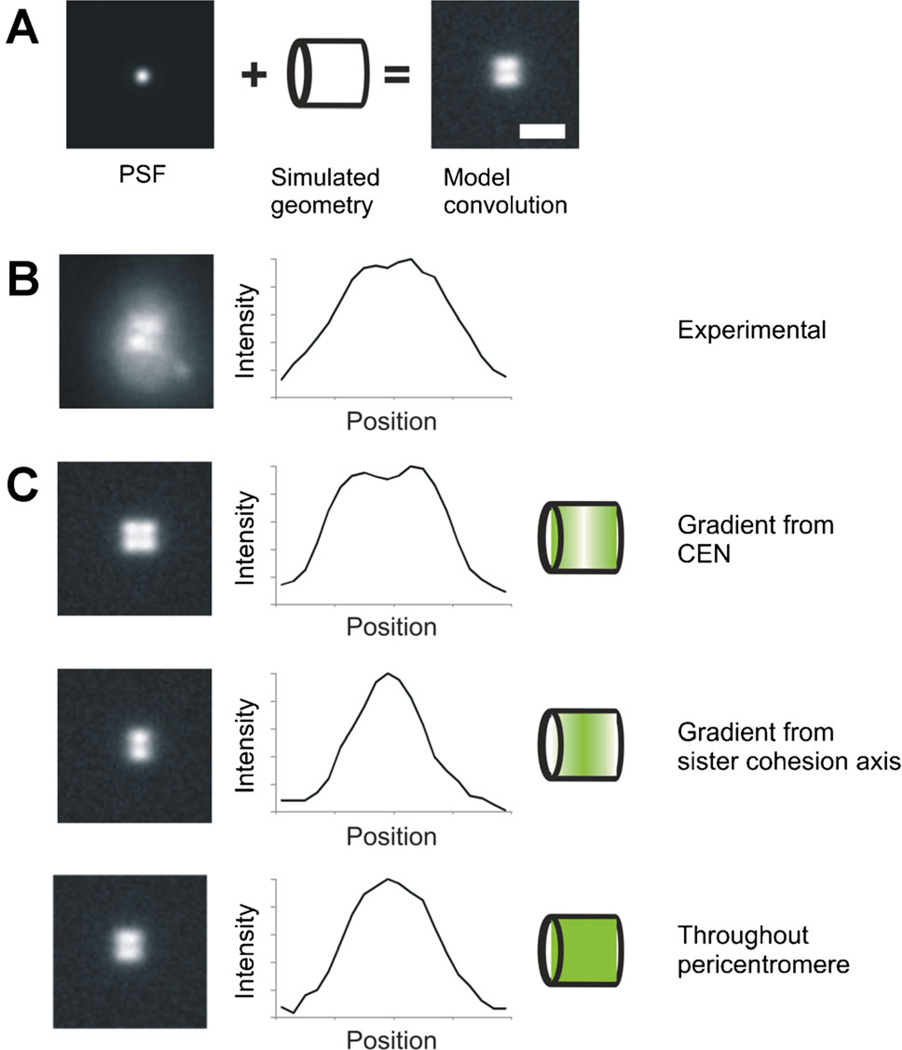
Fig. 3.
A: Model convolution requires knowledge of the point spread function (PSF) and a simulated geometry to produce an image that can then be compared to experimentally acquired data. B: Experimental image of cohesin (SMC3-GFP) viewed side-on appears bilobed. C: In order to further understand the distribution and organization of cohesin during metaphase, we compared the experimental distribution to various modeled geometries. Introducing a gradient from either the centromere or the center (sister chromatid cohesion axis), resulted in intensity profiles that did not match the experimental data in (B). When cohesin distribution was modeled as distributed throughout the pericentromere region, the intensity profile matched experimental data, showing that cohesin distribution is not characterized by a concentration gradient.

