Fig. 4.
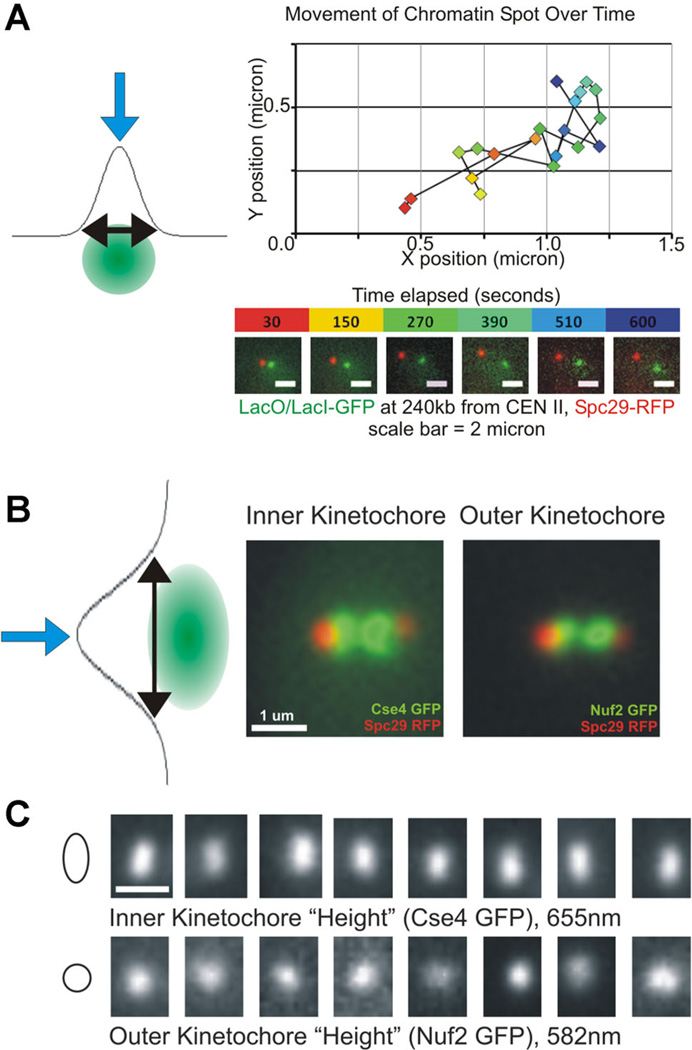
A: The precise localization of a blurred point source of light can be achieved by fitting the fluorescent signal with a Gaussian distribution, as illustrated by the blue arrow at the apex. An example of precise localization of a labeled chromatin spot performed over time is shown, and these data can be used to perform mean square displacement (MSD) analysis or examine viscoelastic properties of the polymer. B: In addition to measuring precise localization (blue arrows), fitting with Gaussian distributions can be used to measure spot size (black arrows). This method reveals differences in kinetochore spot shape between the inner (Cse4) and outer (Nuf2) kinetochores (adapted from Haase et al., 2012). C: Various individual images illustrating the increased spot size along the vertical axis of the inner kinetochore (mean = 655nm) not present when examining outer kinetochore spots (mean = 582 nm; adapted from Haase et al., 2012).

