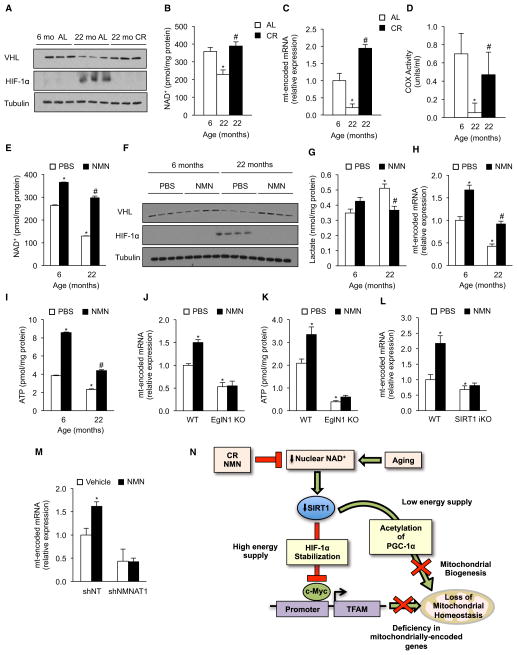
Figure 7. Increasing NAD+ Levels Rescues Age-Related Pseudohypoxia and OXPHOS Dysfunction through a SIRT1-HIF-1α Pathway.
(A) Immunoblot for HIF-1α and tubulin of 6- and 22-month-old AL and 22-month-old CR mice.
(B) NAD+ levels in the same cohorts as in (A) (n = 5, *p < 0.05 versus 6-month-old animals; #p < 0.05 versus 22-month-old AL).
(C) Expression of mitochondrially encoded genes of the same cohorts as in (A). Values normalized to 6-month-old mice (n = 5, *p < 0.05 versus 6-month-old mice; #p < 0.05 versus 22-month-old AL).
(D) Cytochrome c oxidase (COX) activity (n = 4, *p < 0.05 versus 6-month-old animals; #p < 0.05 versus 22-month-old AL).
(E) NAD+ levels in 6- and 22-month-old mice treated with vehicle (PBS) or NMN (n = 6, *p < 0.05 versus 6-month-old PBS; #p < 0.05 versus 22-month-old PBS).
(F) Immunoblot for VHL, HIF-1α, and tubulin of same cohorts as in (E).
(G) Lactate levels of same cohorts as in (E) (n = 6, *p < 0.05 versus 6-month-old PBS; #p < 0.05 versus 22-month-old PBS).
(H) Expression of mitochondrially encoded genes of same cohorts as in (E). Values normalized to 6-month-old PBS mice (n = 6, *p < 0.05 versus 6-month-old PBS; #p < 0.05 versus 22-month-old PBS).
(I) ATP content of same cohorts as in (E) (n = 6, *p < 0.05 versus 6-month-old PBS; #p < 0.05 versus 22-month-old PBS).
(J) Expression of mitochondrially encoded genes in WT and EglN1 KO mice treated with either vehicle (PBS) or NMN (n = 5, *p < 0.05 versus WT PBS).
(K) ATP content of same cohorts as in (J) (n = 5, *p < 0.05 versus WT PBS).
(L) Expression of mitochondrially encoded genes of WT and SIRT1 iKO mice treated with either vehicle (PBS) or NMN (n = 4, *p < 0.05 versus WT PBS).
(M) Expression of mitochondrially encoded genes in primary myoblasts transduced with NMNAT1 or nontargeting shRNA treated with either PBS or NMN (n = 4, *p < 0.05 versus shNT vehicle).
(N) Nuclear-mitochondrial communication and its decline during aging. Nuclear NAD+ levels regulate mitochondria via a PGC-1α-independent pathway that ensures the correct stoichiometry of OXPHOS subunits, but over time, a chronic pseudohypoxic response is activated, inhibiting OXPHOS. Mitochondrially encoded genes were ND1, Cytb, COX1, and ATP6.
Values are expressed as mean ± SEM. See also Figure S6.

