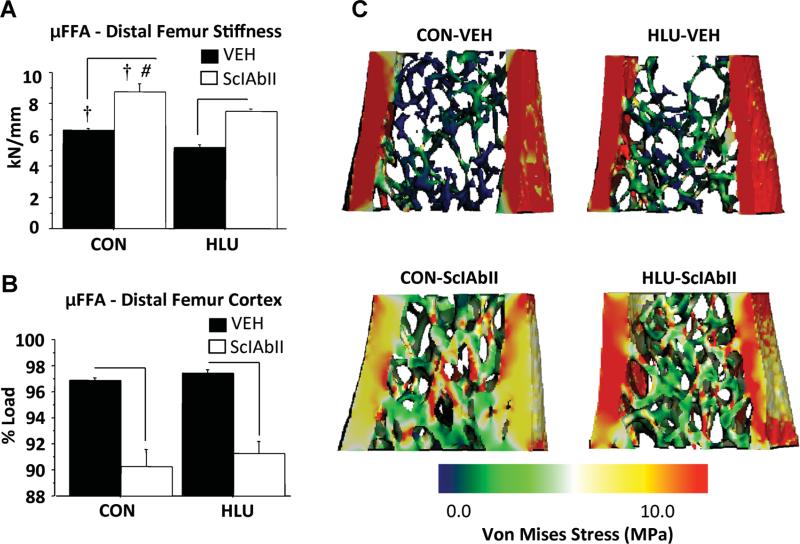
Fig. 5.
Effect of unloading and sclerostin antibody treatment on bone strength, as assessed by micro–finite element analysis (μFEA) of the distal femur: (A) stiffness, (B) % cortical load, (C) representative μFEA Von Mises Stress color map images. Horizontal bars designate significant differences between VEH and SclAbII within loading group (p < 0.05); †p < 0.01 for CON versus HLU within a treatment group; #significantly greater effect of SclAbII in CON versus HLU (p < 0.02); Error bars represent 1 SEM.

