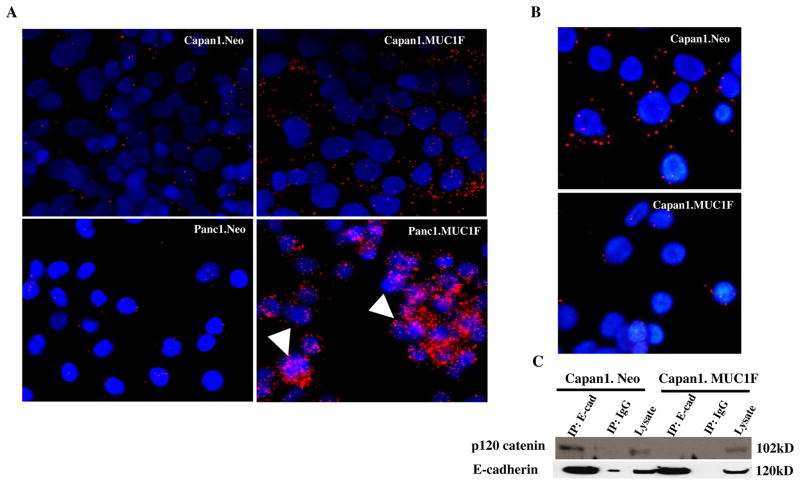
Fig. 2. MUC1 expression increases interactions between p120 catenin and MUC1 but decreases p120 catenin association with E-cadherin.
(A) Association of p120 catenin and MUC1 was evaluated by proximity ligation assay in pancreatic cell lines. Capan1.Neo vs Capan1.MUC1F; Panc1.Neo vs Panc1.MUC1F. Red dots indicate positions of interaction between p120 catenin and MUC1. Blue color (DAPI stain) indicates nuclei. The arrow indicates p120 catenin and MUC1 interactions in the nucleus. The images are single confocal planes, and additional interactions were observed in additional z-stacks. (B) Proximity Ligation assay was used to detect interactions between p120 catenin and E-cadherin in control (neo) and MUC1 overexpressing (MUC1) Capan1 cells. The red dots indicate interactions between p120 catenin and E-cadherin. Blue (DAPI) staining indicates nuclei. (C) Lysates of control and MUC1 overexpressing Capan1 cells were immunoprecipitated (IP) with an antibody to E-cadherin and blotted for p120 catenin and E cadherin. Loading controls for total lysates are also shown.

