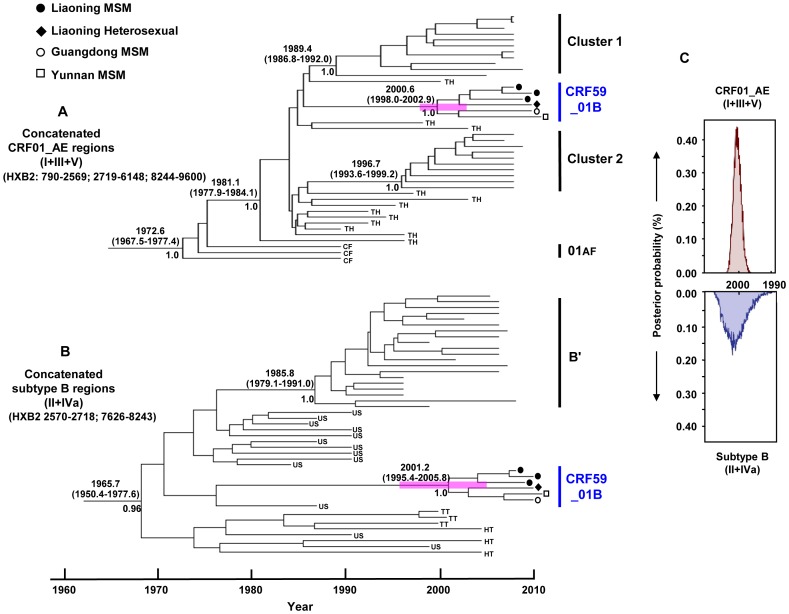
Figure 4. Maximum clade credibility (MCC) trees of CRF59_01B.
The MCC tree was obtained by Bayesian Markov Chain Monte Carlo (MCMC) analysis of the concatenated CRF01_AE [(Regions I+III+V) (HXB2: 790–2569; 2719–6418; 8244–9600)] regions and subtype B [(Regions II+IVa) (HXB2: 2570–2718; 7626–8243)] regions, using a relaxed clock model in GTR+G4 with a constant coalescent model. Analyses were implemented in BEAST v.1.6.0. HIV-1 subtype C sequences are used as an out-group. The medians of the estimated tMRCAs with 95% highest probability density (HPD) (in parentheses) and the posterior probability (>0.95) of the nodes relevant to this study are indicated. (C) The distribution of the posterior probability of the estimated tMRCAs for CRF59_01B as well as the related CRF01_AE lineages (top) and subtype B lineages (bottom).

