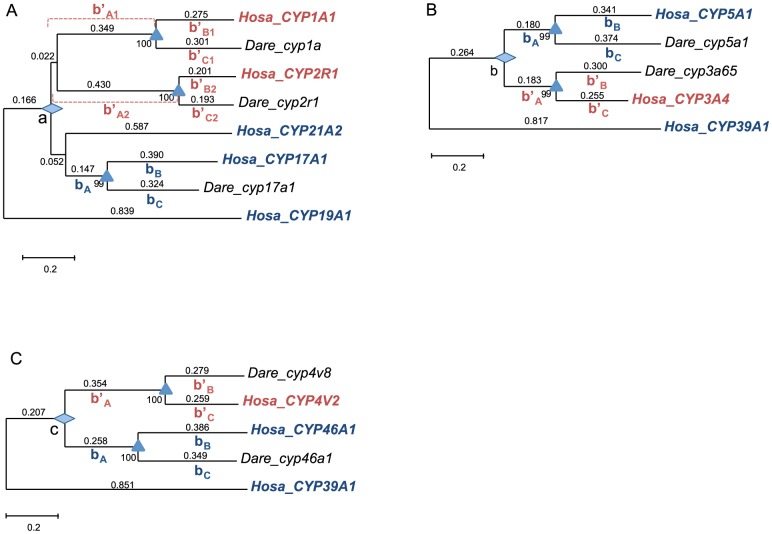
Figure 3. Duplication time of B-type and D-type genes.
A) The divergence between CYP1/2 and 17A1/21A2. B) The divergence between CYP3A and 5A1. C) The divergence between CYP4 and 46A1. The divergence between humans and zebrafish was used as a calibration time ( = 400 mya), and is shown as a triangle in each tree. The duplication event is shown as a diamond. b A, b B, and b C represent the branch length between the duplication event and species divergence. The branches after species divergence in B-type genes and the branches b′A, b′B, and b′C represent the length of D-type genes. The number near each branch shows the branch length.

