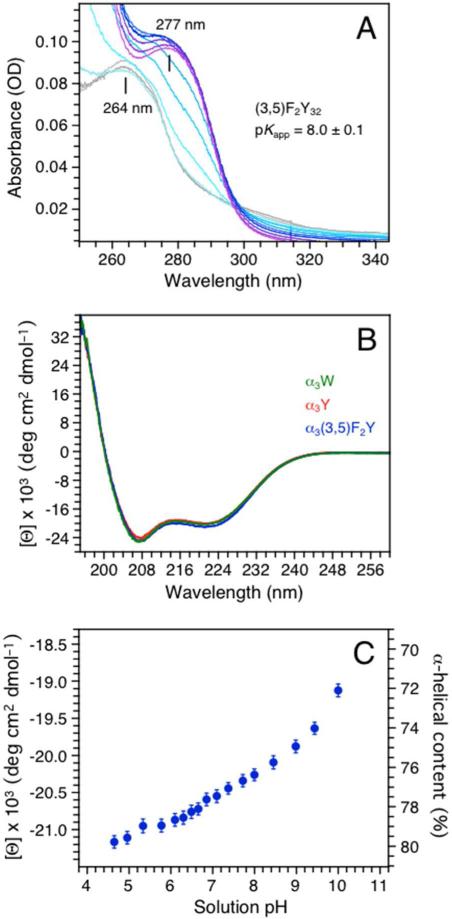
Figure 1.
(A) A pH titration of α3(3,5)F2Y monitored by UV-Vis absorption spectroscopy. Spectra were collected at pH 5.72 (gray), 6.38, 6.84, 7.49, 8.06, 8.53, 8.96, 9.31, 9.59, 10.02 and 10.42 (purple). (B) Far-UV CD spectra of α3(3,5)F2Y (blue), α3Y (red) and α3W (green) in 20 mM sodium acetate, pH 5.62 ± 0.01. The single aromatic residue in each protein is fully protonated at this pH. The CD spectra are displayed in units of mean residue molar ellipticity ([Θ]) obtained by: ([Θ]) = θobs(106/Cln) where θobs is the observed ellipticity in mdegrees (spectrometer raw signal), C the protein concentration in μM, l the cuvette path length in mm, and n the number of amino-acid residues (65). [Θ]222 equals –20.0 ± 0.8 × 10³ deg cm2 dmol–1 at pH 5.6 for α3(3,5)F2Y (Table 1). (C) Changes in the mean residue molar ellipticity ([Θ]) and the corresponding % α-helical content of α3(3,5)F2Y between pH 4.7 and 10.

