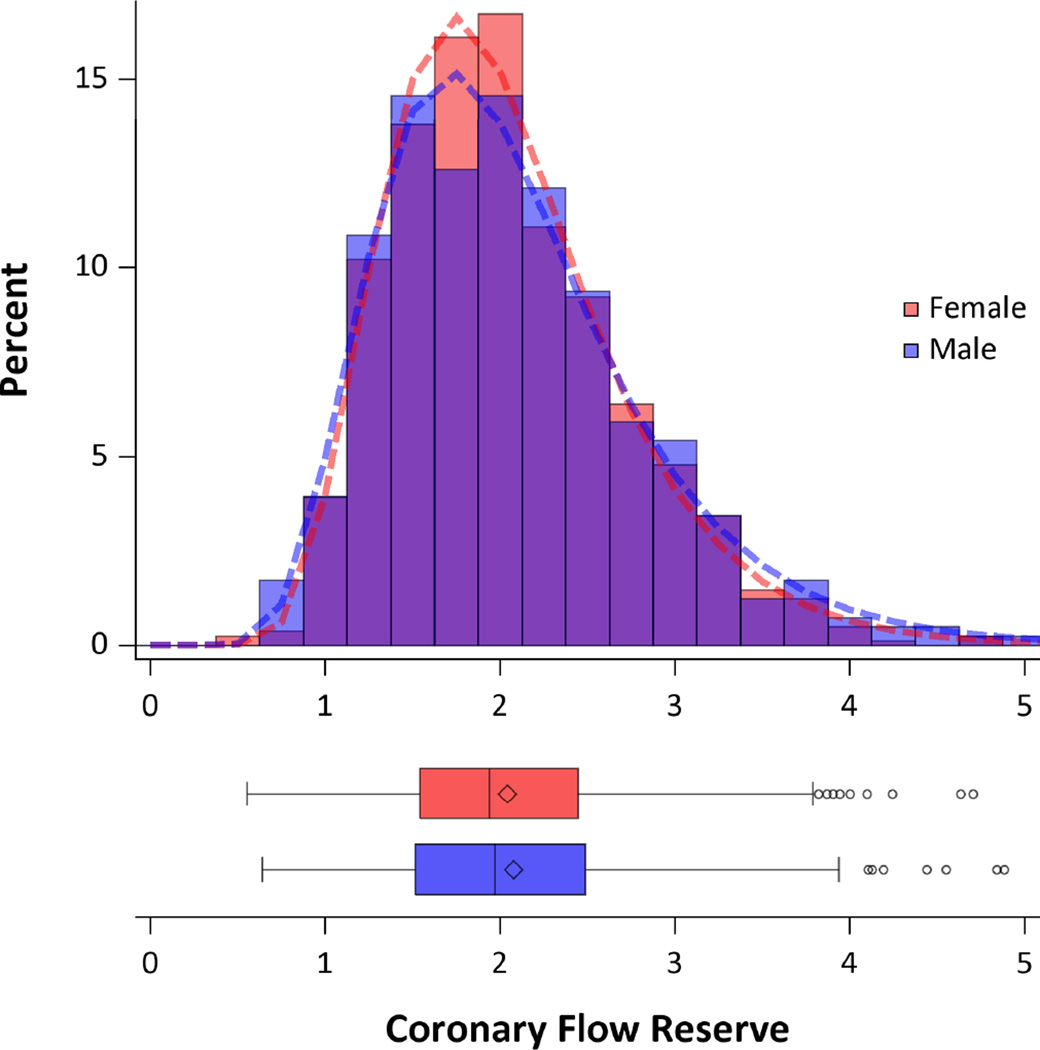
Figure 1.
Distribution of Coronary Flow Reserve by Gender. Histogram (top) showing the distribution of coronary flow reserve for men (blue) and women (red). Areas of overlap are shown in purple. Fitted log-normal distribution for men (dashed blue line) and women (dashed red line) are also displayed. Similar data are also shown in box plots (bottom). No statistically significant difference was seen between genders using t-test with log-normal distribution (P=0.73). CFR was equivalent between the genders (P=0.0005 for <10% difference) using two one-sided tests and log-normal distribution.

