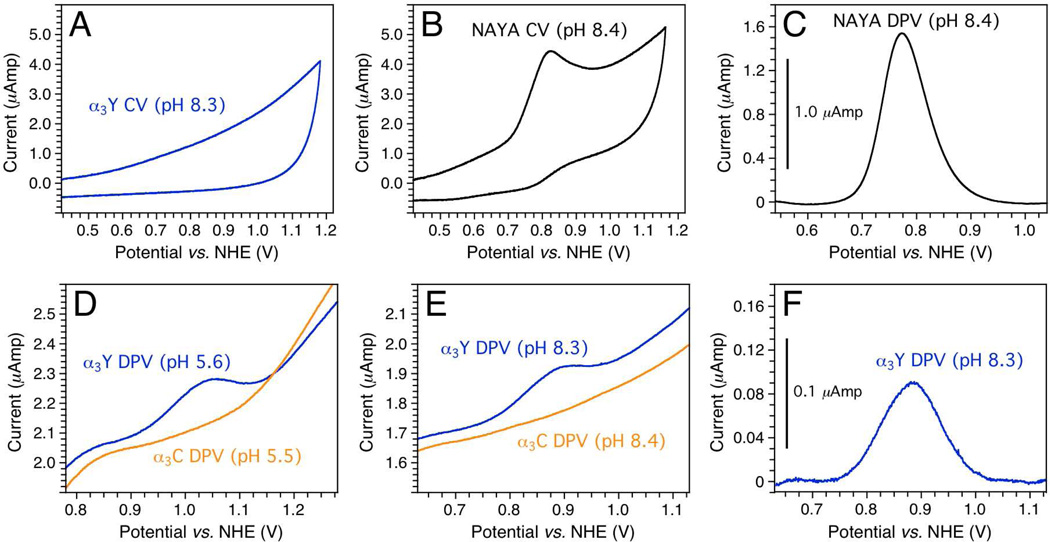
Fig. 1.
Electrochemical properties of α3Y and control samples. (A) Cyclic voltammogram of 210 µM α3Y in 20 mM potassium phosphate, 20 mM sodium borate, 40 mM KCl, pH 8.33; scan rate 200 mV/s, iR-compensation 103 ohm. (B) Cyclic voltammogram of 200 µM NAYA in 20 mM potassium phosphate, 20 mM sodium borate, 200 mM KCl, pH 8.37; scan rate 200 mV s−1, iR-compensation 103 ohm. (C) Differential pulse voltammogram of 200 µM NAYA in 20 mM potassium phosphate, 20 mM sodium borate, 200 mM KCl, pH 8.37; interval time 0.1 s, step potential 1.05 mV, scan rate 10.5 mV s−1, modulation time 8 ms, modulation amplitude 50 mV. The trace has been baseline corrected. (D) Differential pulse voltammograms of (blue) 210 µM α3Y in 20 mM sodium acetate, 20 mM potassium phosphate, 40 mM KCl, pH 5.56 and (orange) 200 µM α3C in 20 mM sodium acetate, 20 mM potassium phosphate, 40 mM KCl, pH 5.46; interval time 0.1 s, step potential 1.05 mV, scan rate 10.5 mV s−1, modulation time 5 ms, modulation amplitude 50 mV. (E) Differential pulse voltammograms of (blue) 210 µM α3Y in 20 mM potassium phosphate, 20 mM sodium borate, 40 mM KCl, pH 8.33 and (orange) 200 µM α3C in 20 mM potassium phosphate, 20 mM sodium borate, 40 mM KCl, pH 8.45; interval time 0.1 s, step potential 1.05 mV, scan rate 10.5 mV s−1, modulation time 8 ms, modulation amplitude 50 mV. (F) Baseline-corrected trace of the α3Y differential pulse voltammogram shown in Panel E.

