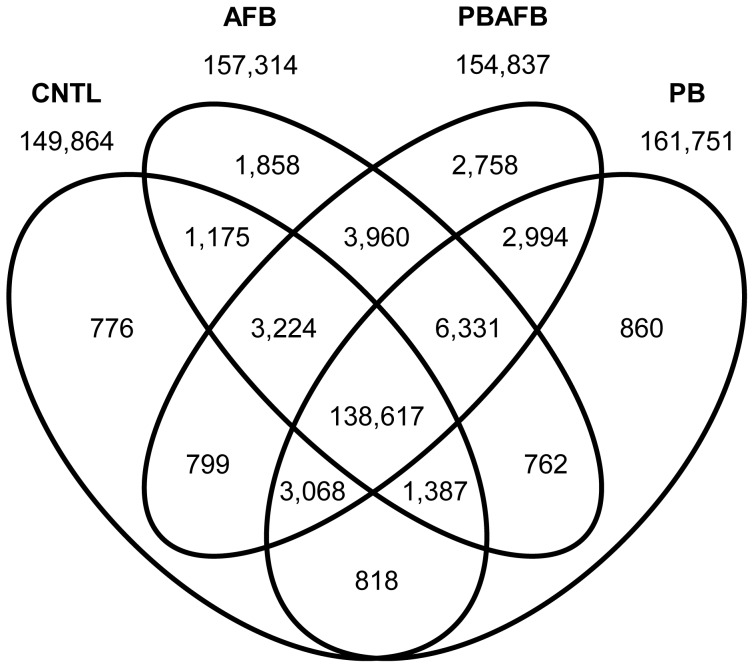
Figure 1. Comparative transcriptome content in domestic turkey liver.
The number of transcripts shared or unique to each combination of treatments after filtering is indicated in each section of the diagram. Totals for the control (CNTL), aflatoxin B1 (AFB), probiotic mixture (PB), and probiotic + aflatoxin B1 (PBAFB) groups are shown above each ellipse.

