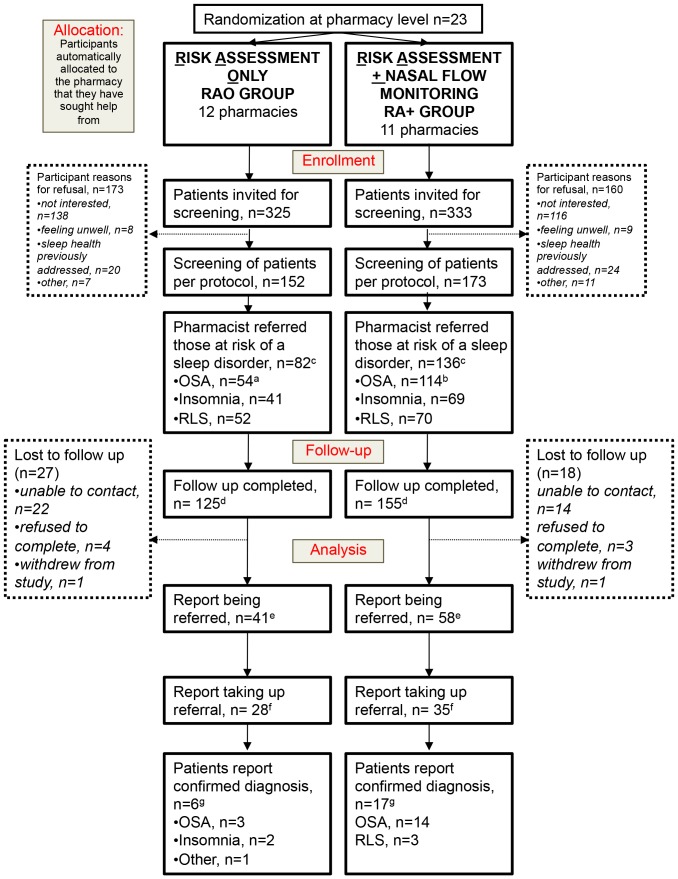
Figure 2. CONSORT diagram showing participant flow throughout the study.
a Participants may be classified as at risk of more than one condition. b Comprises n = 76 identified by questionnaire and additional 38 identified by flow monitor AHI≥18 alone in the RA+ group. Comparison between groups: c number at risk of a sleep disorder as identified by pharmacist as a proportion of number screened, OR 3.2, 95% CI 1.7–6.3, p = 0.0009. d follow-up completed as proportion of number screened OR 1.6, 95% CI 0.54–4.5, p = 0.39. e Participants who report being referred as proportion of number referred, in those completing follow-up, OR 1.3, 95% CI 0.69–2.7, p = 0.40. f Participants who report taking up referral (i.e. actually seeing their medical practitioner) as proportion of those referred and completing follow-up, OR 0.65, 95% CI 0.26–1.6, p = 0.31. g Participants diagnosed as proportion of numbers screened, OR 2.7, 95% CI 1.1–7.5, p = 0.03.

