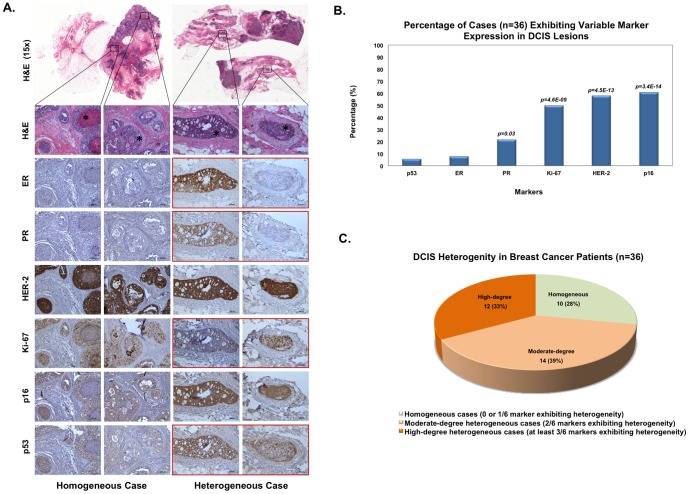
Figure 1. Evaluation of intra-individual DCIS heterogeneity among patients (n = 36) concurrently diagnosed with IDC and DCIS.
(A) Examples of intra-individual homogeneity and heterogeneity in IHC marker expression of DCIS lesions. In an example of a homogeneous case (left), expression of all markers is similar across DCIS lesions. All markers within this case were classified as having no variable expression; therefore, this case is not considered to have intra-individual heterogeneity in the DCIS lesions. The example of a heterogeneous case on the right panels has variable expression of ER, PR, Ki-67, and p53 (highlighted in red; not all lesions shown in figure). Because more than three markers exhibited variable expression, this case has a high-degree of heterogeneity within the DCIS lesions. All but the top panels were taken at 100× magnification. (B) Percentage of cases exhibiting variable expression of IHC markers. For each IHC marker (i.e., p53, ER, PR, Ki-67, HER2, or p16) in an individual case to be considered as having variable expression, at least 20% of the DCIS lesions were required to have different expression levels compared to the majority of lesions. P-values represent how significant the differences are relative to a hypothesized baseline value of 10% variability in staining. (C) Intra-individual heterogeneity in DCIS. Cases were considered as having a moderate- or high-degree of heterogeneity if at least 2/6 or 3/6 markers, respectively were classified as having variable marker expression.

