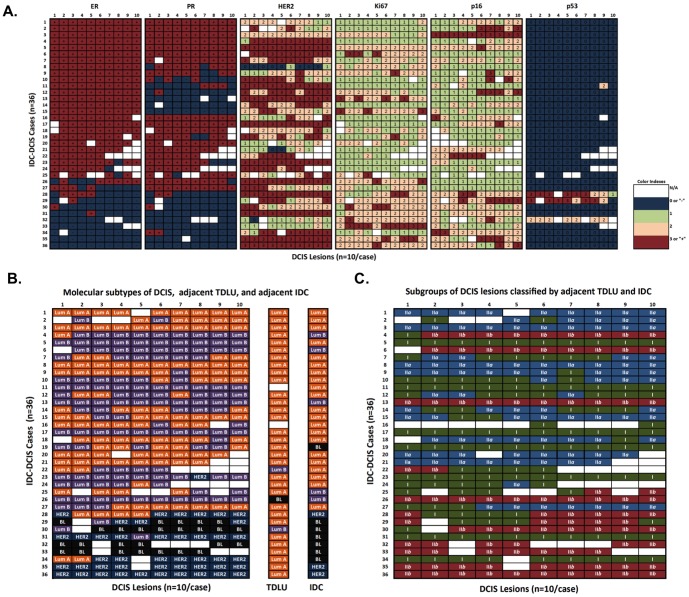
Figure 2. IHC marker scores and DCIS classification among individual DCIS lesions from patients with IDC and DCIS (n = 36).
(A) Heat map of IHC markers for DCIS lesions. This heat map illustrates marker scoring for each individual DCIS lesion across six IHC markers. The individual lesions are aligned in columns and the unique patients are aligned in rows. (B) Molecular subtypes of DCIS lesions, adjacent TDLU, and IDC for each case. Subtypes including luminal A-like (ER+ and/or PR+, HER2−), luminal B-like (ER+ and/or PR+, HER2+), HER2+-like (ER−, PR−, HER2+), and basal-like/triple negative (ER−, PR−, HER2−) are classified according to hormone receptor status. (Lum: luminal; BL: basal-like; TDLU: terminal duct lobular units; blank: data is not available) (C). By comparing DCIS lesions with the molecular subtypes of adjacent IDC and the hormone receptor status in adjacent TDLU, DCIS lesions from each IDC-DCIS case were first classified into two subgroups based on the molecular subtypes of adjacent IDC: DCIS Subgroup I, which presented different molecular subtypes from the adjacent IDC; DCIS Subgroup II, which presented the same molecular subtypes as adjacent IDC. Then the Subgroup II DCIS lesions were further divided into Subgroup IIa (with the same molecular subtypes as both adjacent IDC and TDLU) and Subgroup IIb (with the same molecular subtypes as the adjacent IDC but not the same subtypes as the adjacent TDLU).

