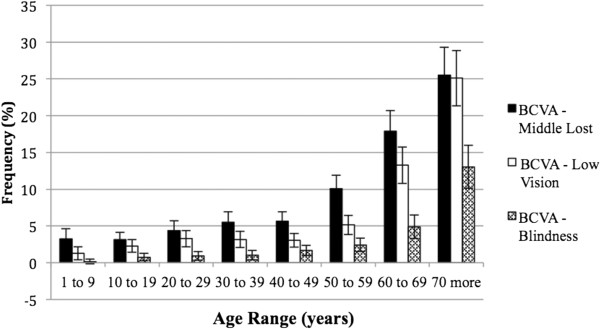
Figure 3.

Relative frequency of visual acuity levels less than 0,15 logMAR after spectacles, according to age in west region of state of São Paulo, Brazil – 2004/2005.

Relative frequency of visual acuity levels less than 0,15 logMAR after spectacles, according to age in west region of state of São Paulo, Brazil – 2004/2005.