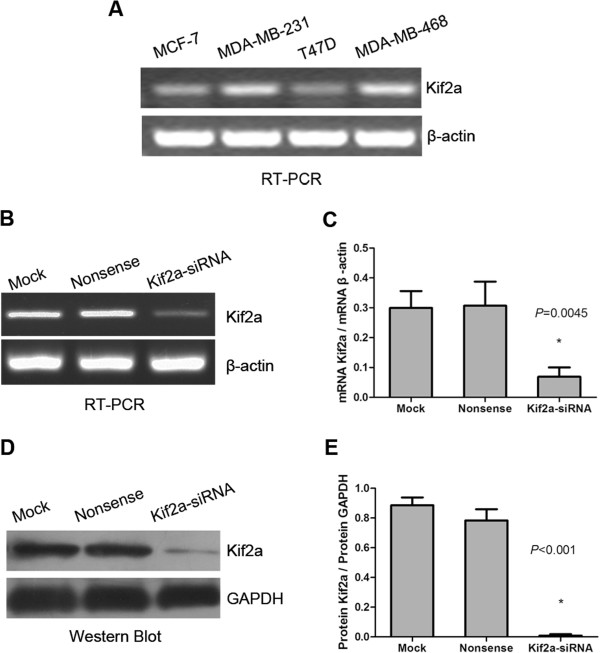
Figure 3.

KIF2A gene silencing with KIF2A–siRNA. The cell lines MCF-7, MDA-MB-231, T47D and MDA-MB-468 were screened by RT-PCR for expression of KIF2A, with MDA-MB-231 showing the strongest expression level (A). MDA-MB-231 cells were transfected with mock, nonsense-siRNA, and KIF2A–siRNA. The expression of KIF2A mRNA (B) and protein (D) in the group transfected with KIF2A–siRNA decreased significantly compared to the two control groups (PmRNA = 0.0045, Pprotein < 0.001). β-Actin and GAPDH were used as controls. Data were expressed as the relative ratio of KIF2A mRNA and protein to that of β-actin and GAPDH (C, E). All experiments were done in triplicate.
