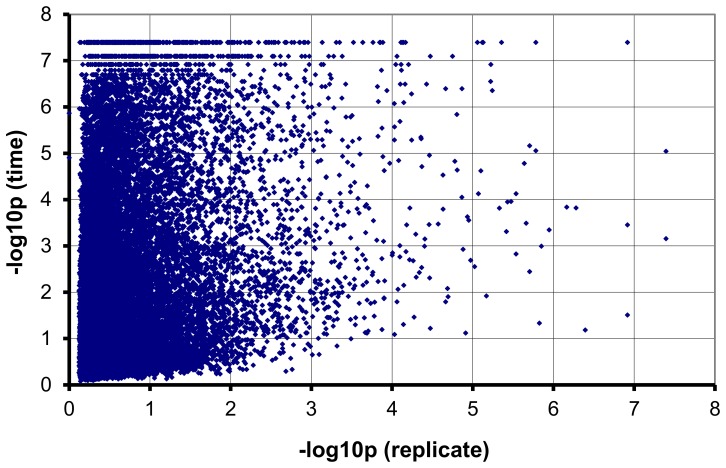
Figure 2. Negative correlation between the significance of time and replicate effects.
Plot of -Log10 of the significance of the replicate effect (Y-axis) versus the -Log10 of the significance of the time effect (X-axis), indicating a much stronger time effect than undesired variation between replicates. Minimum P-value within replicates of all time points is located on the abscissa (X-axis) and minimum P-value of all ratios compared to 0hpe is located on the ordinate (Y-axis).

