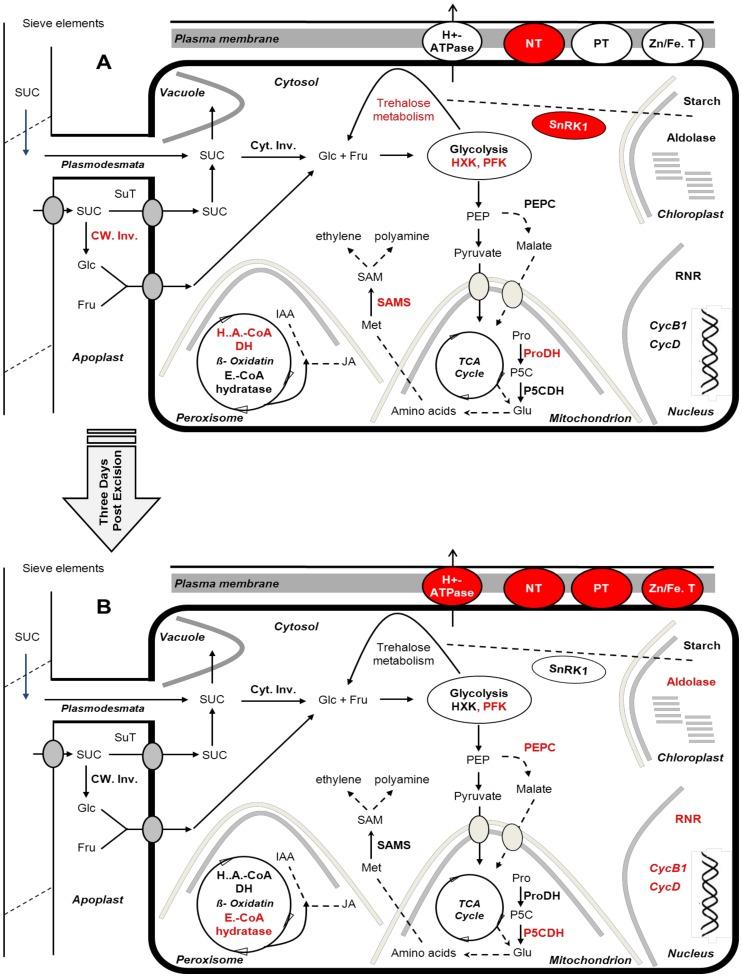
Figure 6. Schematic illustration of metabolic pathways regulated during AR formation in petunia cuttings.
In the figure, only important induced key genes in primary metabolism, cell replication machinery, signalling and membrane transport are included. Induced genes are shown in red color. Because the observed gene expression patterns in R and M phases were not significantly different and to simplify the figure, only two phases have been illustrated. (A) SE phase (B) R and M phases. NT: nitrate transporter, PT: phosphate transporter, Zn/Fe.T: zinc/iron transporter, Cyt. Inv: cytosolic invertase; CW Inv: cell wall invertase; SuT: sucrose transporter; PFK: phosphofructokinase, HXK: hexokinase, RNR: ribonucleotide reductase; PEPC: phosphoenolpyruvate carboxylase; H.A.CoA DH: 3-hydroxyacyl-CoA dehydrogenase; E.CoA hydratase: enoyl-CoA hydratase; Pro: proline; ProDH: proline dehydrogenase; P5CDH: pyrroline-5-carboxylate dehydrogenase; Met: methionine; SAMS: S-adenosylmethionine synthase; SAM: S-adenosylmethionine.

